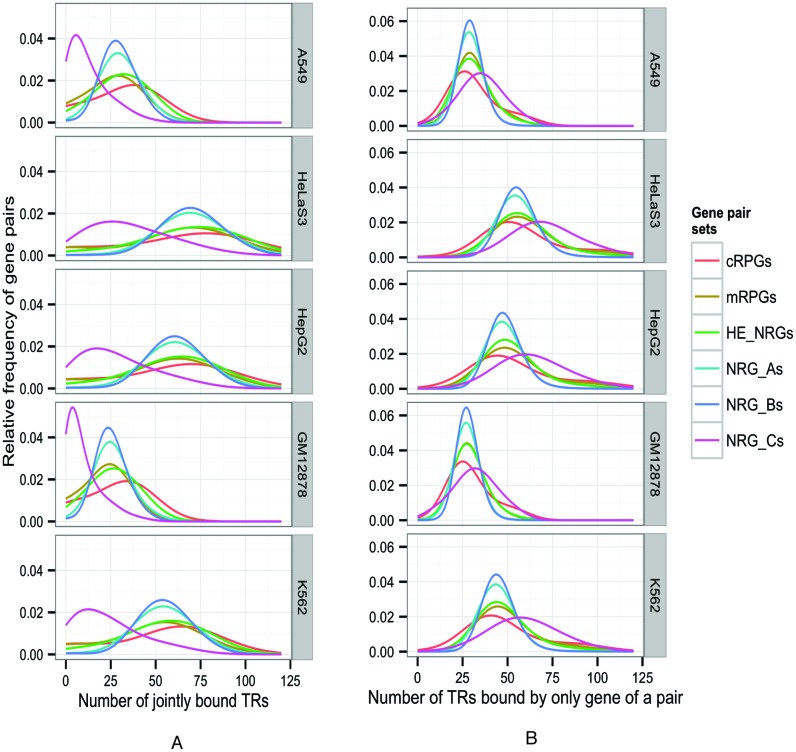
Figure 3.
(A). More TRs bind to both genes in co-expressed gene pairs than in independently expressed pairs (NRG_C's, max(P) < 10−32, Wilcoxon test). (B) Conversely, fewer TRs bind to only one gene in co-expressed gene pairs than in NRG_C's (max(P) < 10−32). The number of TRs that may be associated with co-regulation depends on the TRs mapped in a cell type. The number of TRs implicated in co-regulation ranges from 25 (in A549 and GM12878 cells) to over 50 (in HeLaS3, HepG2 and K562 cells).

