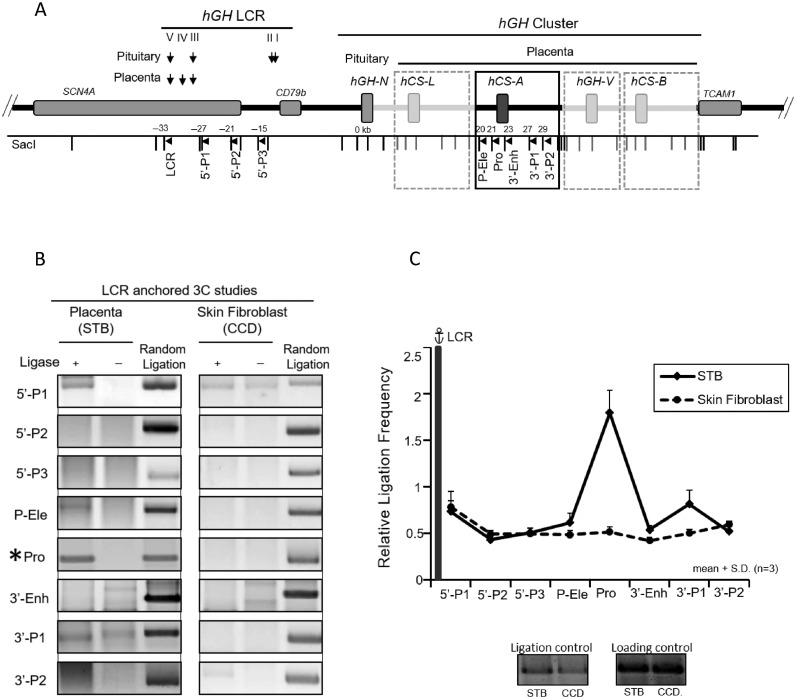
Figure 1.
Looping of the hGH locus control region (HSIII–V) to the hGH gene cluster in primary human placental syncytiotrophoblasts. (A) hGH locus and corresponding 3C mapping strategy. The structures of the hGH gene cluster and flanking regions are displayed in the diagram. The positions of the DNaseI hypersensitive site (HS) that constitute the hGH LCR in the placenta and pituitary are shown. A SacI map is displayed below the diagram; distances (kb) are shown relative to the hGH-N promoter. Primers used in the 3C assays are designed to proceed in the same direction and are indicated by arrowheads under corresponding restriction fragments. A 6 kb SacI fragment encompassing HSIII-V (‘LCR’) was used as an anchor for the assay. The structures of the highly conserved placental gene repeat (PGR) units, corresponding to hCS-L, hCS-A, hGH-V and hCS-B, are labeled in the boxed diagram of the representative hCS-A PGR unit. Of note, the ‘promoter’ primer (Pro) site is conserved among all five genes in the cluster. (B) 3C analysis of the hGH locus using the hGH LCR (HSIII–V) as anchor. Analyses of primary human STB chromatin (left panels) and human skin fibroblasts (CCD; right panels) are displayed. PCR amplicons of the LCR-anchored 3C products were resolved on a 2% argarose gel and stained with SYBR Gold. In each panel, the left lane contains 3C products, the middle lane is generated by a parallel reaction lacking ligase in the 3C assay, and the right lane (control) contains the random ligation products of a SacI-digested hGH/BAC DNA. The only validated 3C product generated in this STB analysis corresponds to the ligation of the LCR anchor and the promoter-containing SacI fragment (‘Pro’) (labeled by *). All other products failed to align with the random ligation control products and failed to be re-cleaved by SacI. (C) The hGH LCR (HSIII-V) loops to the promoter(s) within the hGH cluster. 3C ligation products (as in B) were quantified by PhosphorImager and QuantOne software. The ‘relative ligation frequency’ was determined by the ratio of the 3C ligation product to random ligation product. This ratio was then normalized to the ERCC3 ligation control and loading control (see Materials and Methods). The plot shows the average values from three analyses, each beginning with an independently generated chromatin preparation. The promoter (Pro) primer is perfectly complementary to the promoters of all five of the genes in the cluster. Error bars indicate one standard deviation. These data reveal close proximity of the placental LCR to the promoter region(s) of hGH/hCS gene(s) in STB chromatin (solid line). This proximity was not seen in a parallel analysis of primary skin fibroblasts (dotted line).

