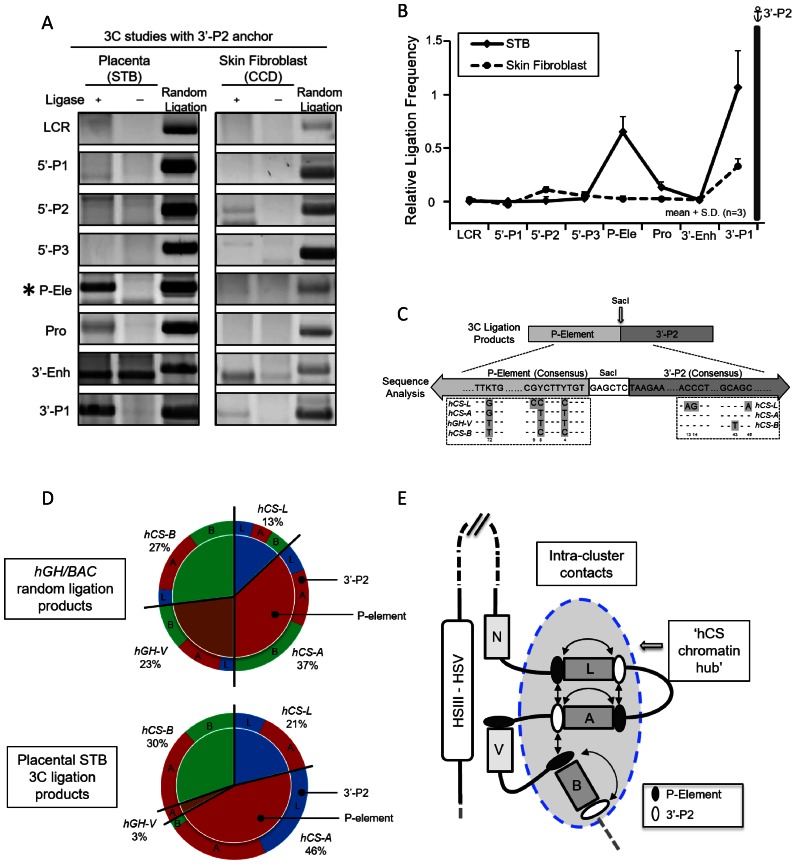
Figure 3.
Structural analysis of interactions within the hGH cluster in primary human placental syncytiotrophoblasts. (A) 3C analysis of hGH locus using the 3′-P2 anchor fragment located at the 3′ end of the PGR unit. The 3′-P2 anchor fragment (see Figure 1A) is conserved in all three hCS genes (hCS-A, -B and -L). The analysis of the PCR assay of ligation products is organized as in Figure 1B. (B) 3C analysis reveals proximity of the 3′-P2 anchor with the conserved P-elements. Ligation frequencies (calculated as in Figure 1C) of each indicated sites are displayed in the graph. The interactions between the P-element and the 3′-P2 site in the primary human placental STB cells (solid line) were not observed in primary human skin fibroblasts (dotted line). (C) Specification of interactions amongst 3′-P2 and P-element fragments. The 3′-P2 anchor/P-element 3C ligation products were cloned and sequenced and the specific identity of each interaction was determined. Diagnostic sequence divergences in the P-elements and the 3′-P2 regions were used to identify specific interactions within the PGR units as highlighted inside the dashed boxes. The sequencing analysis confirmed the accurate ligation of the P-element fragment and 5′-end of 3’P-2 fragment across the SacI restriction site in all products tabulated. (D) Quantitation of ligation frequencies between specified 3′-P2 and P-element sites. The relative ligation frequencies are displayed in the compound pie charts. The top graph represents products from a random ligation of SacI-digested hGH/BAC plasmids and the bottom graph represents the ligation frequencies within the placental STB chromatin locus. The numbers of clones analyzed were 96 and 102, respectively. The random ligation control data reveals the P-elements from each PGR unit were evenly distributed in their interaction frequencies (top, inner circle) and each P-element interacted with different 3′-P2 fragments (top, outer circle) at approximately the same frequency. In contrast, the analysis of the STB sample revealed that the P-elements from three hCS genes were involved in 97% of the ligations, while only 3% involved the hGH-V (bottom, inner circle). P-element interactions with 3′-P2 fragments were also highly selective; there was a complete absence of interactions between hCS-L and hCS-B, and only trace evidence for interactions of the P-element of hCS-A with 3′-P2 fragment of hCS-B (bottom, outer circle). (E) Model of higher-order interactions within the hGH cluster in primary human placental syncytiotrophoblast chromatin. This diagram integrates the results of the 3C analysis internal to the hGH gene cluster (as shown in D). The interactions between P-element and 3′-P2 regions within the hGH cluster are represented by double-headed arrows. The selective long-range contacts of the placental LCR (HSIII–V) with the promoters of the hGH-N and hGH-V genes (Figure 2) appear to sequester these two genes away from the ‘hub’ of interactions internal to the cluster.

