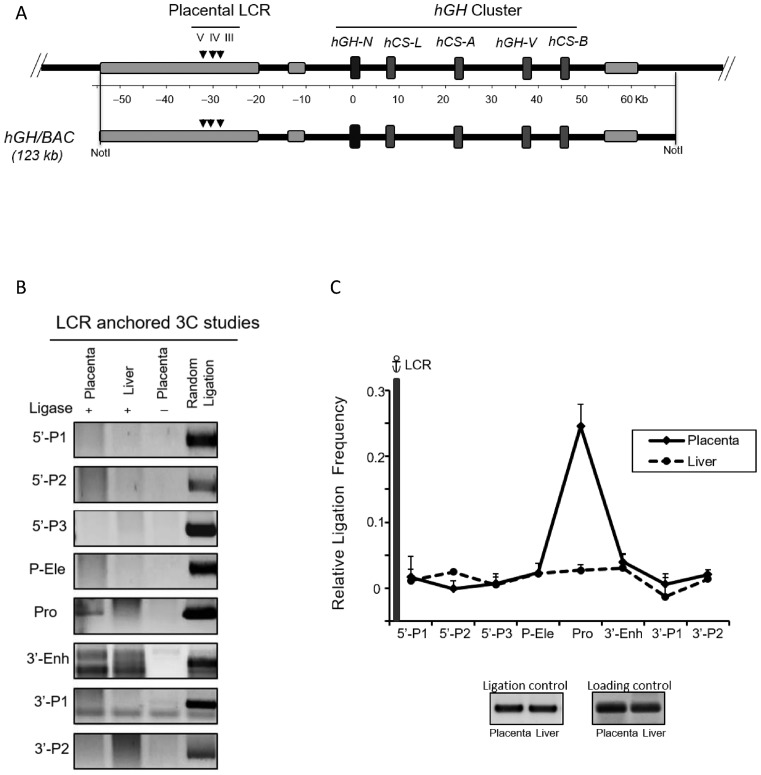
Figure 5.
Looping between the hGH LCR (HSIII–V) and the hGH/CS promoters is accurately modeled at the hGH/BAC transgene locus in the mouse placenta. (A) Diagram of the native hGH locus and the corresponding hGH/BAC transgene. A NotI released 123 kb fragment of human genomic DNA, encompassing hGH gene cluster along with its 5′ LCR and 3′-flanking region, represents the extent of the hGH/BAC transgene. Landmarks are as in Figure 1A. hGH/BAC transgenic mouse lines were generated from the released 123 kb NotI fragment (20). (B) 3C analyses of the hGH/BAC locus in transgenic mouse placenta and liver. Chromatin from placenta (E18.5) and adult liver of hGH/BAC transgenic mice were analyzed by 3C using the LCR anchor fragment (as in Figure 1). PCR-amplified ligation products are displayed as in Figure 1B. (C) hGH LCR loops to promoters within the hGH/BAC transgene locus in mouse placenta. 3C ligation products (as in B) were quantified by PhosphorImager and by QuantOne software (see Materials and Methods). The data were quantified and normalized as in Figure 1C. The looping of the hGH LCR (HSIII–V) to promoters within the hGH/BAC transgene cluster is identical to that observed in primary human STB cells (Figure 1C).

