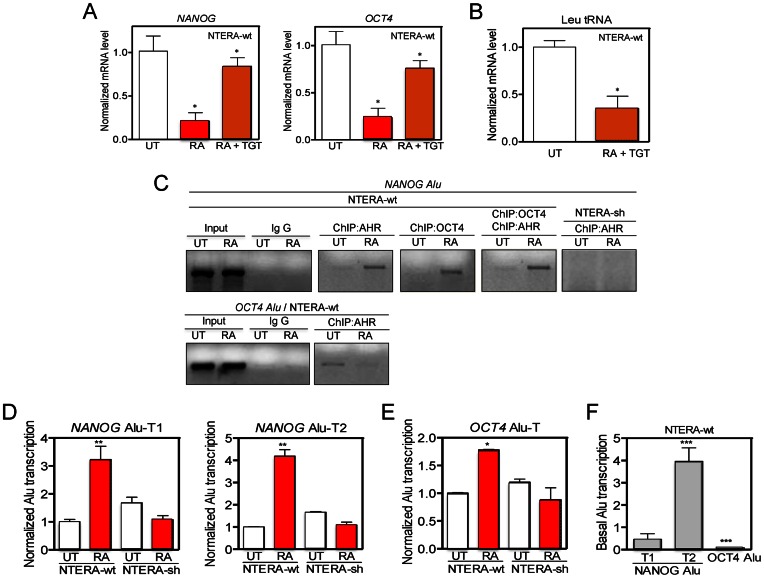
Figure 4.
OCT4 and NANOG Alus bind AHR, are transcribed by RNA polIII in differentiated cells. (A) NANOG and OCT4 mRNA levels were quantified in NTERA-wt cells left untreated (UT), treated with 1 mM RA or with 1 mM RA + 10 mM tagetitoxin (TGT) for 48 h. (B) Leu tRNA levels were measured in NTERA-wt cells untreated (UT) or treated with 1 mM RA + 10 mM TGT for 48 h. (C) Chromatin immunoprecipitation (ChIP) for AHR and OCT4 binding to the NANOG and OCT4 Alus was done in NTERA-wt cells left untreated (UT) or treated with 1 μM RA for 48 h. For specificity, one primer for the PCR reaction to amplify each Alu was located in a unique genomic sequence flanking the transposon (see Supplementary Table S1). Double ChIPs involved a first immunoprecipitation with anti-OCT4 followed by a second immunoprecipitation with anti-AHR antibody. NTERA-sh cells were used as negative controls. Input DNAs and immunoprecipitations done in absence of specific antibodies were also performed. (D and E) NANOG and OCT4 Alu-derived transcripts were quantified by RT-qPCR in absence (UT) or presence of 1 μM RA using the conditions described in Supplementary Figure S5A-C. (F) Basal levels of NANOG Alu-T1 and Alu-T2 and OCT4 Alu-T were measured in NTERA-wt cells by RT-qPCR. GAPDH mRNA was used to normalize gene expression (ΔCt) and 2−ΔΔCt to calculate variations with respect to control or untreated conditions. Panels A and B: n = 6, two technical replicates in three biological replicates; panel C: n = 4 biological replicates; panels D-F: n = 4, two technical replicates in two biological replicates. *P < 0.05, **P < 0.01 and ***P < 0.001. Data are shown as mean ± SD.

