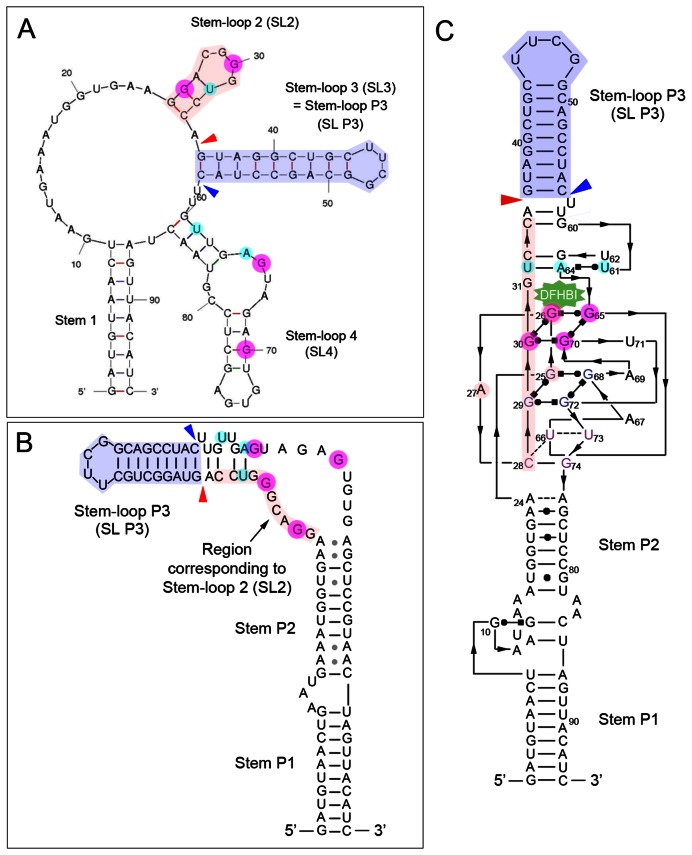
Figure 1.
Spinach2 structure. (A–C) Representations of the computationally predicted (A) and solved (B and C) structures of Spinach2. As the helices were differently named in the two solved structures, for consistency, we have adopted ref. (20) and named the paired regions P1, P2 and P3. (A) Computationally predicted (mFold) structure of Spinach2. (B) Simplified 2D representation of the solved crystal structure of Spinach2, drawn based on Huang et al. (19). (C) Detailed 2D representation of the solved crystal structure of Spinach2, drawn based on Deigan-Warner et al. (20). Magenta circled Gs form the top tetrad of the core G-quadruplex region and cyan circles highlight the bases in the base triple, which is required for Spinach folding (19,20). Light purple shading highlight the bases in each structure that correspond to Stem-loop P3, and light pink shading highlight the bases in each structure that correspond to Stem-loop 2 of the predicted structure (A). The red arrowhead in each structure indicates the position where SL P3 5′ was inserted, and the blue arrowhead indicates the position where SL P3 3′ was inserted (refer to text for Figure 2B).

