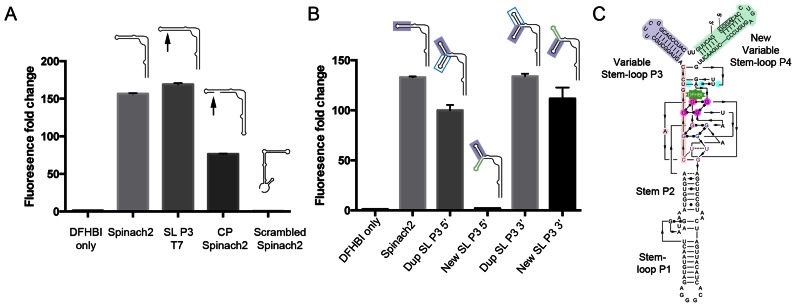
Figure 2.
Features of Pandan sensor design. (A) Fluorescence intensity fold change of Spinach2 and modified versions of Spinach2 compared to the DHFBI-only control. Schematic structures of the different RNAs are shown. Arrows indicate the position of the inserted partial T7 transcriptional start site, GGGA. (B) Fluorescence intensity fold change of sensor designs testing the addition of extra adjacent stem-loop sequences 5′ and 3′ of SL P3 (positions indicated in red and blue arrowheads in Figure 1A–C). Dup SL P3 indicates insertion of a second copy of the SL P3 stem-loop. New SL indicates insertion of an independent randomly chosen sequence of the same length (Details in Supplementary Sequences). (C) Diagram showing the single-molecule version of Pandan with the 5′ and 3′ ends in the added stem-loop P4, based on Deigan-Warner et al. (20). Shading is consistent with Figure 1A–C. The GGGA partial transcriptional start site is boxed. SL P3: Stem-loop P3; SL P3 T7: Spinach2 with an additional GGGA partial T7 transcriptional start site in SL P3; CP Spinach2: circularly permuted (CP) Spinach2. Fluorescence experiments were performed in triplicate. Fluorescence intensity fold change shown is with respect to DFHBI-only controls. Cartoons used in panels A and B are based on the simplified 2D structure from Huang et al. (19) (Figure 1B).

