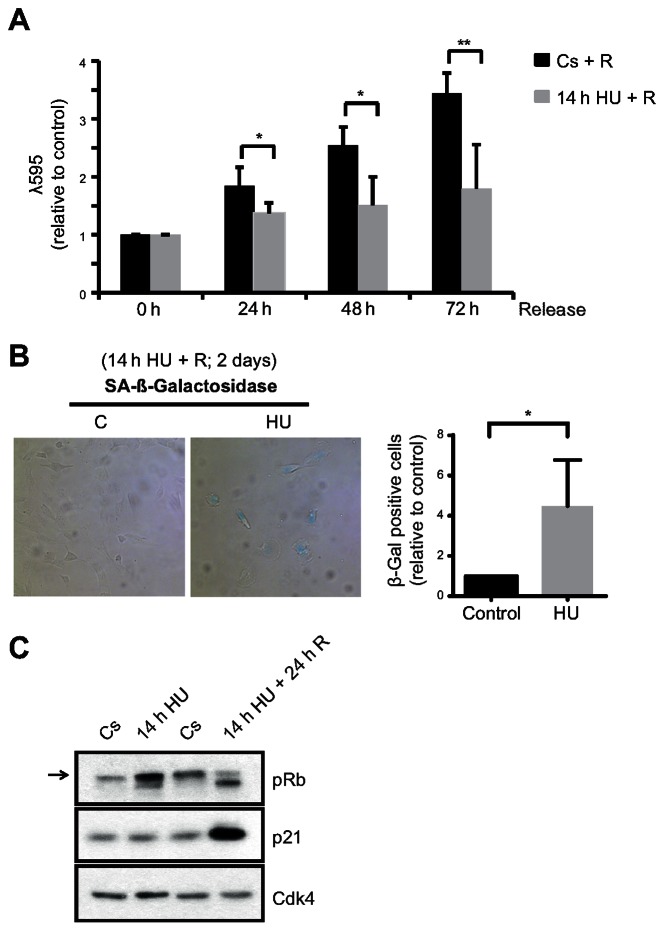
Figure 2.
hTERT-RPE cells become senescent after prolonged DNA replication inhibition. (A) S-phase synchronized (by single thymidine block) hTERT-RPE cells were treated during 14 h with HU or left untreated (Cs) and then released into fresh media. Cells were harvested at the indicated time after the treatment and stained with crystal violet (λ595) to analyse cell proliferation. The average fold increase relative to control in each time point is shown in the graphs (n = 4). (B, C) hTERT-RPE cells were synchronized in S-phase, treated during 14 h with HU or left untreated (C: control) and then harvested (for western blot) or released (R) into fresh media during 24 h (for western blot) or 48 h (for SA-β-Gal analysis). Representative images of SA-β-Gal staining (B, left panel), the average fold increase in SA-β-Gal positive cells relative to control (B, right panel) (n = 4), and whole cell lysate immunoblots (C) are shown. The arrow indicates the hyperphosphorylated band of pRb (Retinoblastoma protein). Cdk4 was used as loading control. Means and standard deviation (bars) are shown. Values marked with asterisks are significantly different (unpaired t-test, *P < 0.05, **P < 0.01).

