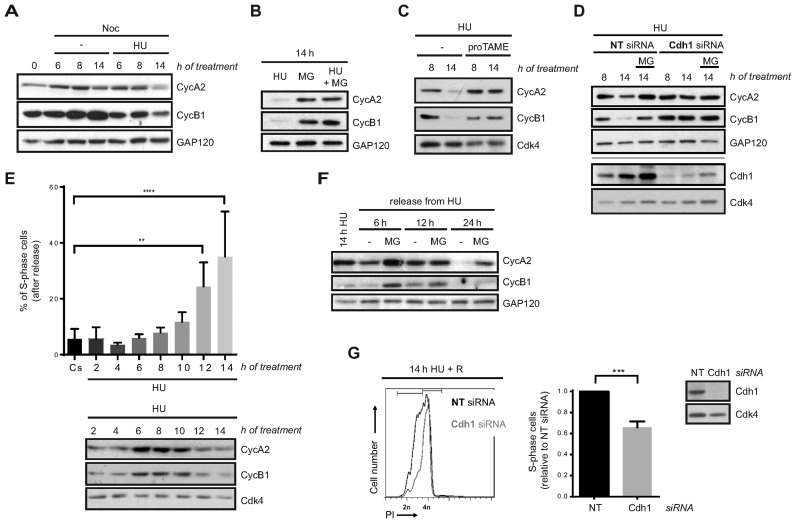
Figure 3.
Loss of DNA replication recovery competence in response to prolonged replication inhibition is APC/CCdh1- dependent. (A, B, C) hTERT-RPE cells were synchronized in S-phase by single thymidine block and then treated during the indicated time with HU or left untreated (-). Whole cell extracts were analysed by western blot with the indicated antibodies. (D) Non-target (NT) or Cdh1 siRNA were transfected to hTERT-RPE cells before S-phase synchronization by single thymidine block. Cells were then treated with HU during the indicated time. Whole cell extracts were prepared and analysed by western blot with the indicated antibodies. (E) S-phase synchronized hTERT-RPE cells were treated during the indicated time with HU or left untreated (Cs) and then harvested for western blot or released into fresh media with nocodazole during 24 h. DNA content was used to determine the number of cells that remain in S-phase after release (upper panel) (n = 4). Whole cell extracts were prepared and analysed by western blot with the indicated antibodies (bottom panel). Means and standard deviation (bars) are shown. Values marked with asterisks are significantly different (paired t-test, **P < 0.01, ****P < 0.0001). (F) S-phase synchronized hTERT-RPE cells were treated during 14 h with HU and then harvested or released into fresh media during the indicated time. Whole cell extracts were prepared and analysed by western blot with the indicated antibodies. (G) hTERT-RPE cells were transfected with the indicated siRNA and then synchronized in S-phase. Whole cell lysates of S-phase synchronized untreated cells were harvested for western blot analysis with the indicated antibodies (right panel). S-phase synchronized cells were treated during 14 h with HU and then released (R) into fresh media with nocodazole during 24 h. DNA content (PI: propidium iodide) was analysed by flow cytometry to quantify the number of cells that remain arrested in S-phase after release. Representative DNA profiles (left panel) and the average fold increase of S-phase arrested cells in Cdh1-depleted relative to non-target siRNA transfected cells are shown in the graph (middle panel) (n = 5). Means and standard deviation (bars) are shown. Values marked with asterisks are significantly different (unpaired t-test, ***P < 0.001). Where indicated, nocodazole (noc), proTAME and MG132 (MG, added during the last 6 h of treatment) were added. Cyc: cyclin. GAP120 and Cdk4 were used as loading control.

