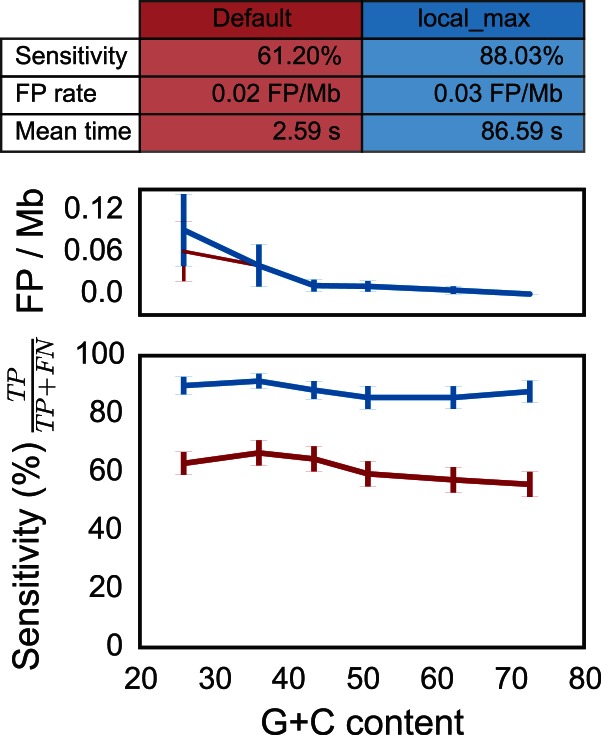
Figure 4.
Quality assessment of the attC sites covariance model on pseudo-genomes with varying G+C content and depending on the run mode (default and ‘- - local_max’). (Top) Table resuming the results. The mean time is the average running time per pseudo-genome on a Mac Pro, 2 × 2.4 GHz 6-Core Intel Xeon, 16 Gb RAM, with options - - cpu 20 and - - no-proteins. (Middle) Rate of false positives per mega-base (Mb) as function of the G+C content. (Bottom) Sensitivity (or true positive rate) as function of the G+C content. The red line depicts results obtained with the default parameters, and the blue line represents results obtained with the accurate parameters (‘- - local_max’ option). Vertical lines represent standard error of the mean. There is no correlation with G+C content (all spearman ρ ∈ [−0.12; −0.04] and all P-values > 0.06).

