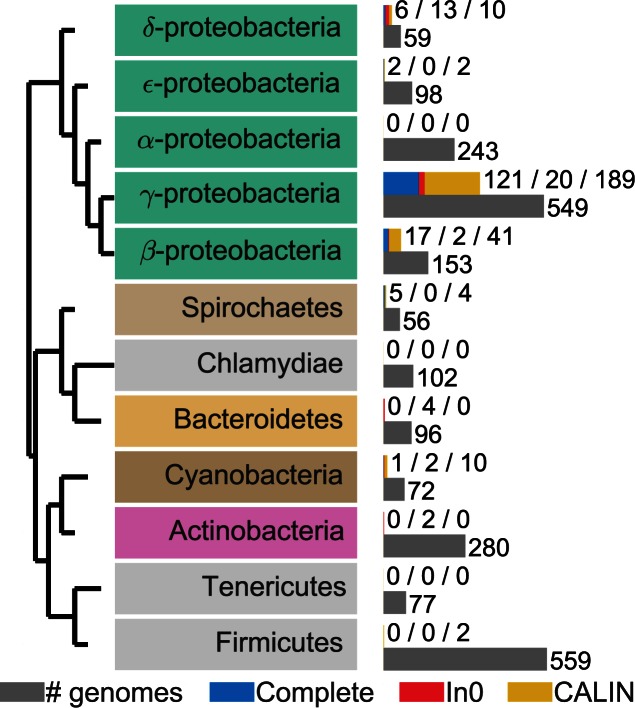
Figure 5.
Taxonomic distribution of integrons in clades with more than 50 complete genomes sequenced. The gray bar represents the number of genomes sequenced for a given clade. The blue bar represents the number of complete integrons, the red bar the number of In0 and the yellow bar the number of CALIN. The colored text boxes refer to the colors in Supplementary Figure S2.

