Figure 6.

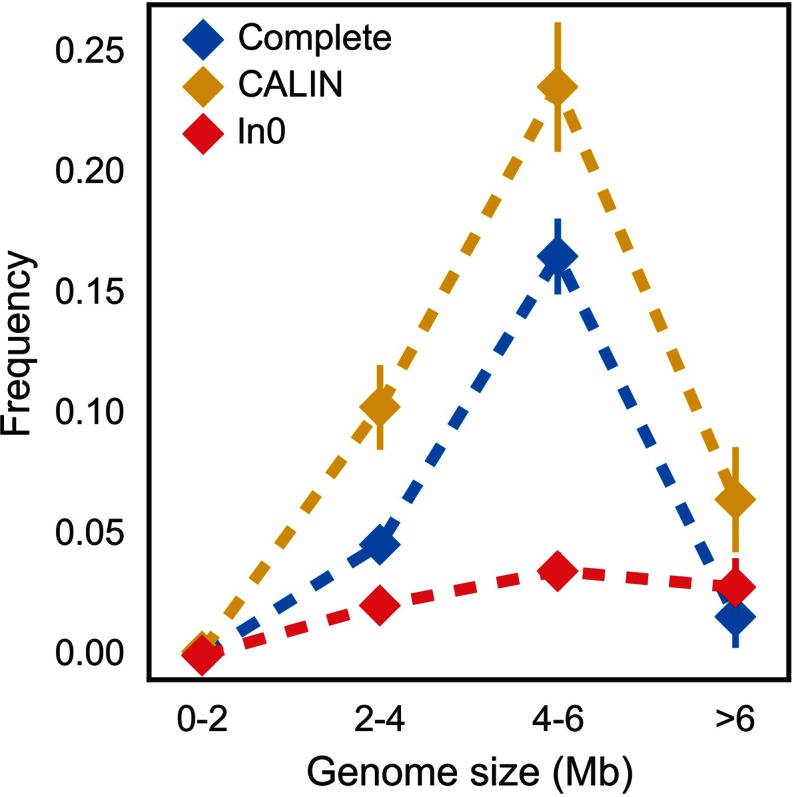
Frequency of integrons and related elements as a function of the genome size. Vertical bar represents standard error of the mean. The sample size in each bin is: 608 [0-2], 912 [2-4], 712 [4-6] and 247 [>6].

Frequency of integrons and related elements as a function of the genome size. Vertical bar represents standard error of the mean. The sample size in each bin is: 608 [0-2], 912 [2-4], 712 [4-6] and 247 [>6].