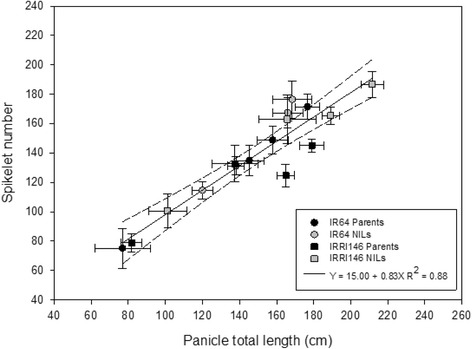
Fig. 3.

Relationships between panicle total length (cm) and spikelet number of main tiller across treatments and experiments of the parents (black symbols) and the NILs (grey symbols) of two genetic backgrounds. Regression curves are associated with confidence interval at P = 0.05 (n = 5 for GH-CNRS, n = 8 for field-IRRI)
