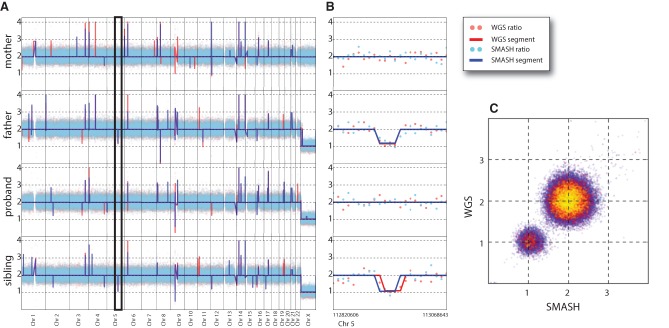
Figure 3.
SMASH and WGS copy number profiles for an SSC quad. (A) The whole-genome view (autosomes and X Chromosomes) for the four members of a family is shown. Red and blue dots indicate the reference and GC normalized ratio values for WGS and SMASH, respectively. Similarly, red and blue lines represent the copy number segmentation by CBS (circular binary segmentation) for WGS and SMASH. (B) A deletion on Chromosome 5 is highlighted (expanded section demarcated in A). The deletion, identified by both methods, occurs in the father and is transmitted to the unaffected sibling. (C) The bin-for-bin comparison of the normalized ratio values of the father from WGS and SMASH is illustrated. Red and yellow points show increasingly sparse subsamples of the data points.

