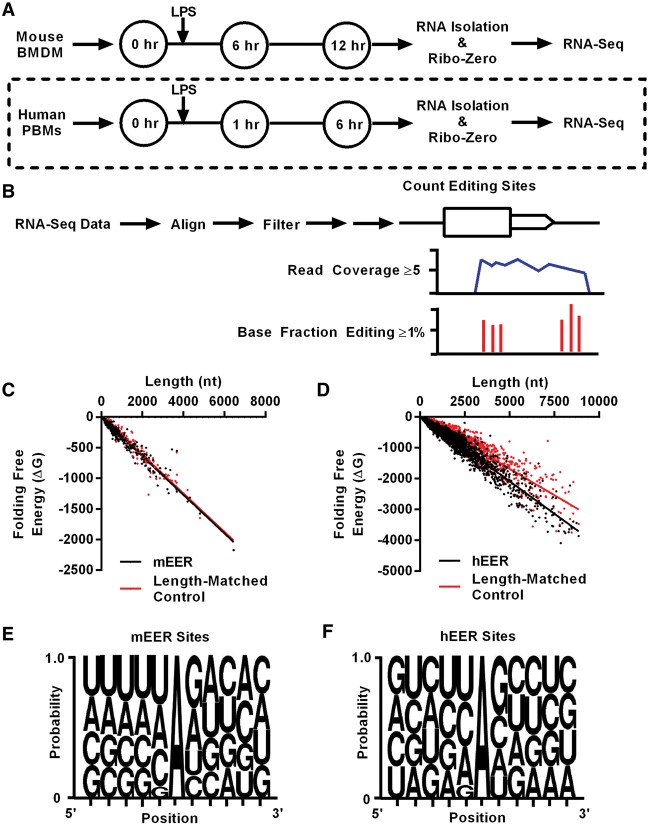
Figure 1.
Identification of EERs in murine macrophages and human monocytes. Experimental setup for RNA-seq analysis of LPS-stimulated (A) mouse BMDMs and human PBMs. Dashed line indicates analysis of existing data sets (Lissner et al. 2015). (B) Brief description of identification of EERs, detailed in Supplemental Figure S1. Folding free energy (ΔG) versus length (nt) plot of (C) mEERs (P = 0.1581) and (D) hEERs (P < 0.0001) compared to length-matched controls. P-values determined by Wilcoxon matched-pairs signed rank test. Weblogos for A-I editing sites in (E) mEERs and (F) hEERs using sites in ≥1% of reads of EERs for all samples combined (Seq2Logo Sequence Logo Generator) (Thomsen and Nielsen 2012). Known SNPs were removed from analyses.

