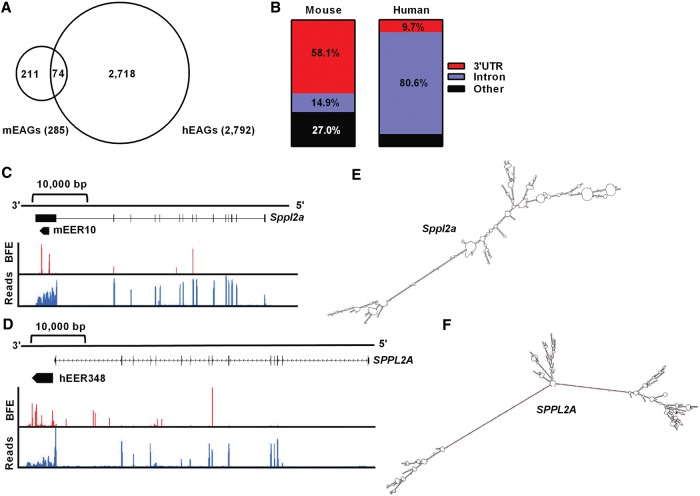
Figure 4.
A subset of mEAGs also have EERs in the human ortholog. (A) Intersection of mEAGs with hEAGs (P < 0.0001 by χ2 test). (B) Primary intersecting feature of conserved EAGs defined as 3′ UTR, Intron, or Other. Gene structure, EER location, base-fraction editing (red, BFE 0%–100%), and relative expression (blue, FPKM, 0–10 reads) are shown for mouse (C) and human (D) Sppl2a/SPPL2A orthologs. Data are for 6 h post-LPS treatment of mouse BMDMs and human PBMs. Mfold-predicted EER structures are compared to the right (E,F).

