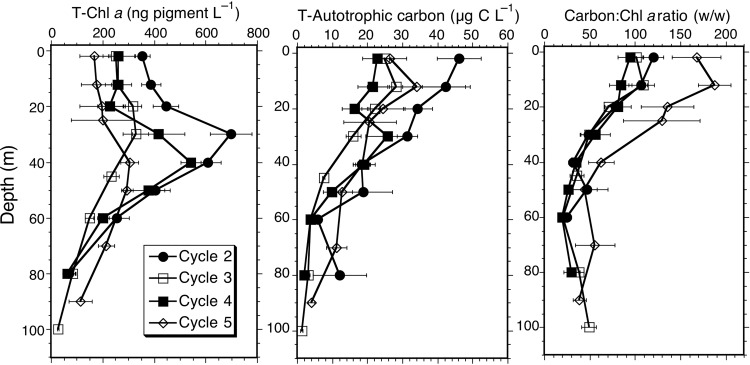
Fig. 3.
Depth profiles for TChl a, total autotrophic carbon biomass and carbon:TChl a ratios for the phytoplankton communities sampled during experimental Cycles 2–5. Symbols are means ± standard errors. The Kruskal–Wallis non-parametric ANOVA tests indicated that the means for TChl a at 20, 30 and 40 m were significantly different among cycles (P = 0.05), but post hoc Dunn tests failed to confirm differences among cycle means.

