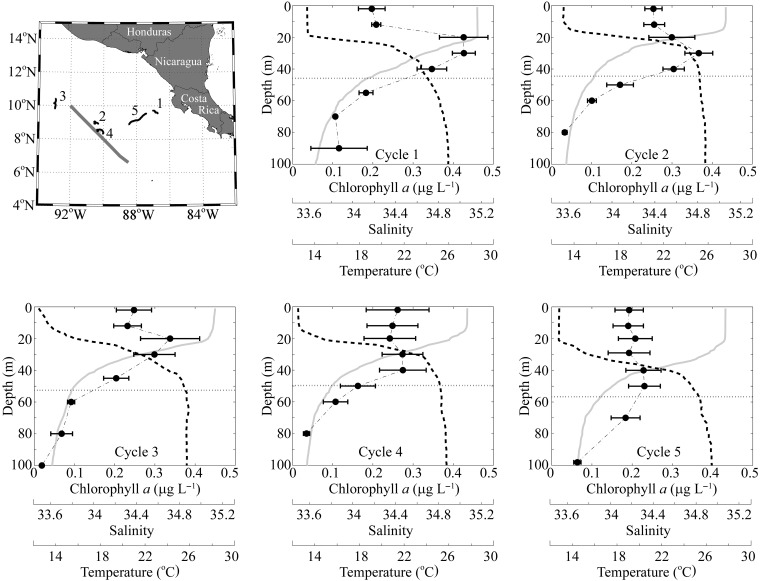
Figure 1.
Cruise overview. Upper left panel shows CRD study region in the Eastern Tropical Pacific. Thick, straight gray line is our transect across the CRD. Curved black and gray lines are the experimental array and sediment trap drifter tracks, respectively. Note that sediment trap tracks are seldom visible at this scale, because the drifters stayed closely together. Numbers label the individual cycles. All other panels show mean Chl a (black circles and dashed-dotted line), salinity (solid gray line) and temperature (black dashed line) depth profiles for the cycles. For Chl a, error bars show the standard error. Horizontal dotted line is depth of the 1% light level.

