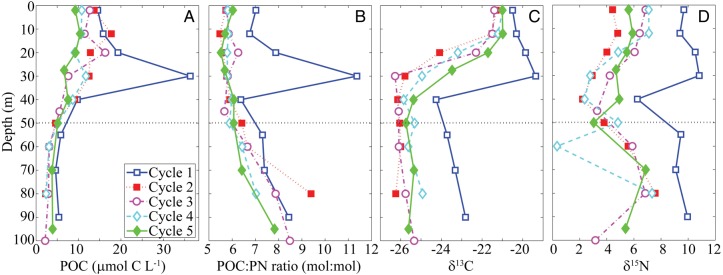
Figure 2.
Particulate organic material (POM) on five experimental cycles. Each profile is the mean of measurements taken on the first and last CTD cast of the cycle. Panel A shows particulate organic carbon (POC) concentrations. Panel B shows ratio of POC to particulate nitrogen (PN). Panels C and D show carbon and nitrogen isotopic content of POM, respectively. Horizontal dotted line is depth of the 1% light level.

