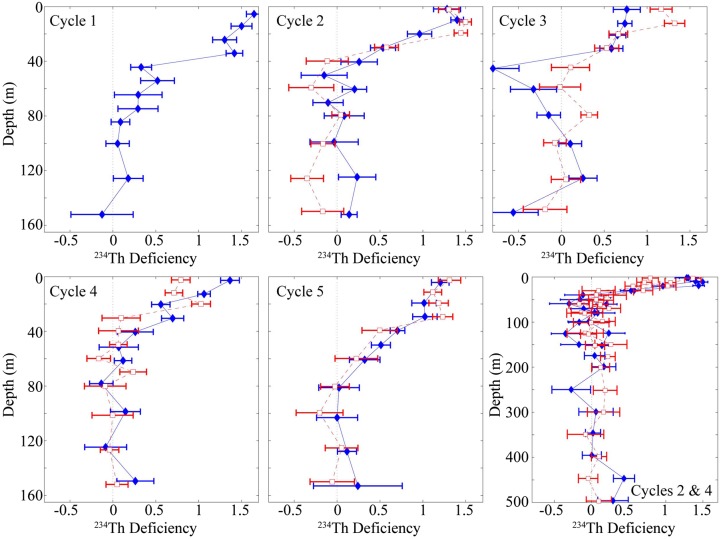
Figure 5.
Thorium deficiency profiles. First five panels show 238U-234Th deficiencies for the epipelagic for each cycle (positive values indicate thorium deficit and are indicative of export). All cycles except Cycle 1 show a profile at the beginning (filled diamonds) and end (open squares) of the 4-day cycle. Bottom right panel shows 238U-234Th deficiency in the mesopelagic for Cycle 2 (filled diamonds) and Cycle 4 (open squares) in the core of the dome. In all panels, error bars are propagation of measurement uncertainty.

