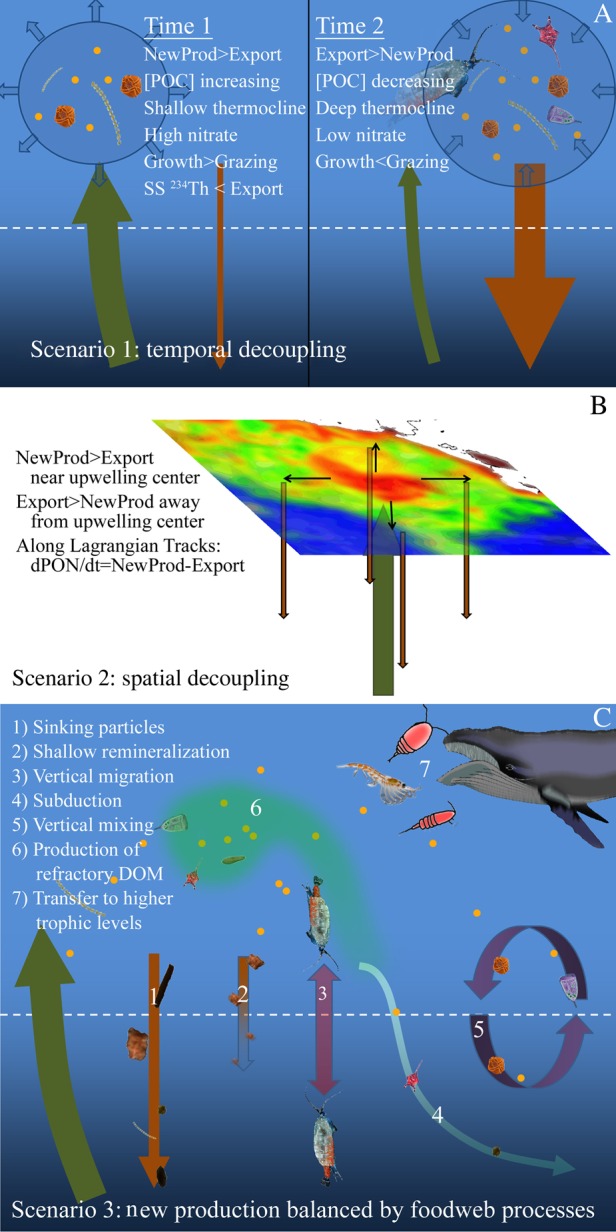
Figure 7.

Schematic diagram showing potential reasons for a deficit of sinking particle export relative to new production. Panel A shows temporal decoupling with the initial (excess new production) condition shown on the left and the subsequent (excess export) condition shown on the right. Panel B shows spatial decoupling at an open-ocean upwelling location. Panel C shows food web and physical transport processes that can lead to additional N export that would not be measured by sediment traps or 234Th.
