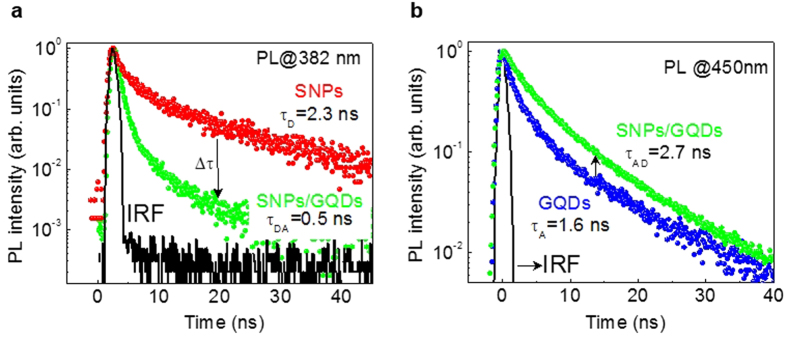
Figure 4. PL decay curves of SNPs, GQDs, and SNPs/GQDs hybrid.
(a) Decay curves of the donor emission at 382 nm for SNPs and SNPs/GQDs hybrid. The average PL lifetime reduces from ∼2.3 to ∼0.5 ns. (b) Decay curves of the acceptor emission at 450 nm for GQDs and SNPs/GQDs hybrid. The average PL lifetime increases from ∼1.6 to ∼2.7 ns. The FRET effect is evidenced by the shortening of the donor decay accompanied by the lengthening of the acceptor decay. The excitations were done at 305 nm.

