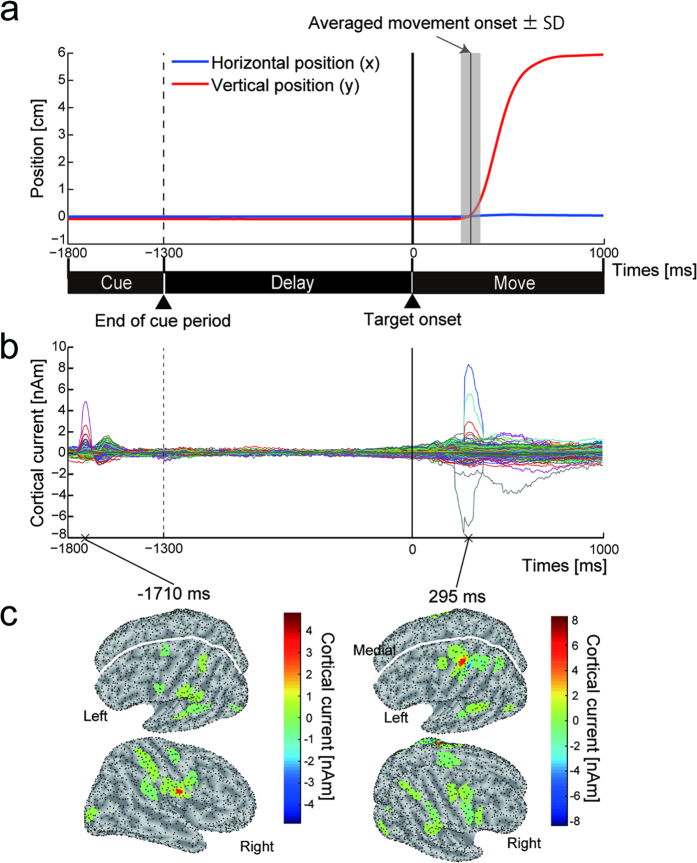
Figure 2. Temporal dynamics of cortical currents for delayed-finger reach task.
(a) Time courses of horizontal (blue) and vertical (red) positions of fingertip when a subject (S1) moved it toward target. Vertical solid line in gray shaded area denotes averaged movement onset ± SD (304.0 ± 50.9 ms). (b) Time courses of cortical currents estimated by a hierarchical Bayesian method. One colored line represents cortical current from one source dipole. Time courses are aligned to target onset (0 ms) and averaged across trials and sessions. Vertical dashed and solid lines indicate end of cue period and target onset timing, respectively. (c) Absolute value of cortical currents rendered on inflated cortical surfaces sampled at 1710 ms before and 295 ms after target onset (corresponding to panel b). Black dots on surface denote vertices at which current dipoles were estimated.

