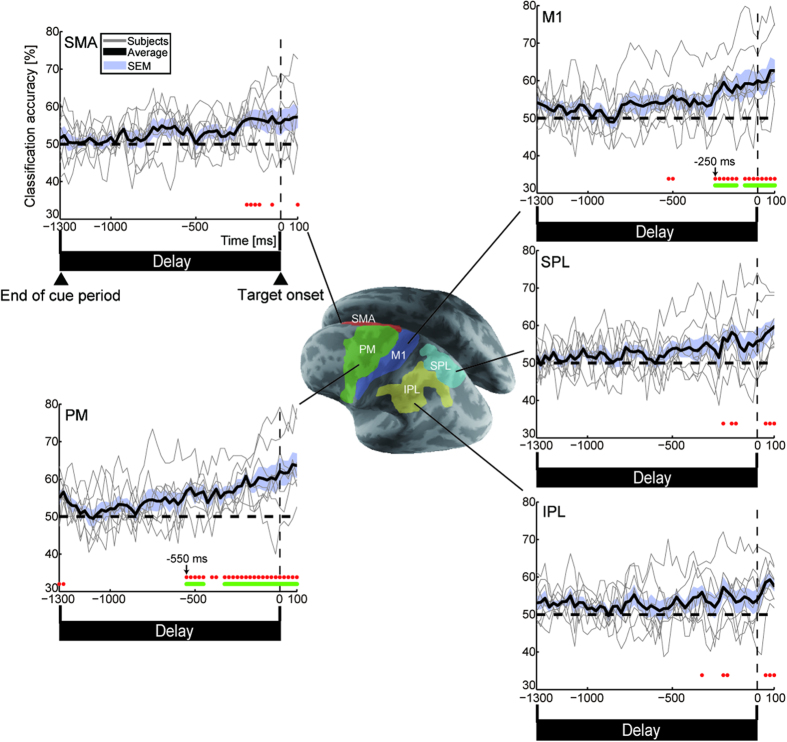
Figure 3. Classification performance in functionally selected areas.
Time courses of classification accuracies in left PM, M1, SMA, SPL and IPL from start of Delay period (−1300 ms) to 100 ms after target onset. Accuracies for individual subjects (thin gray solid lines) were averaged over all subjects (thick black solid lines). Blue shaded area denotes SEM across subjects. Rows of red dots indicate significant time points (n = 8, both two-tailed t-test p < 0.05 and group-level permutation test p < 1 × 10⁻⁴), and green horizontal lines show consecutively significant time points corrected by a time-cluster-based approach.

