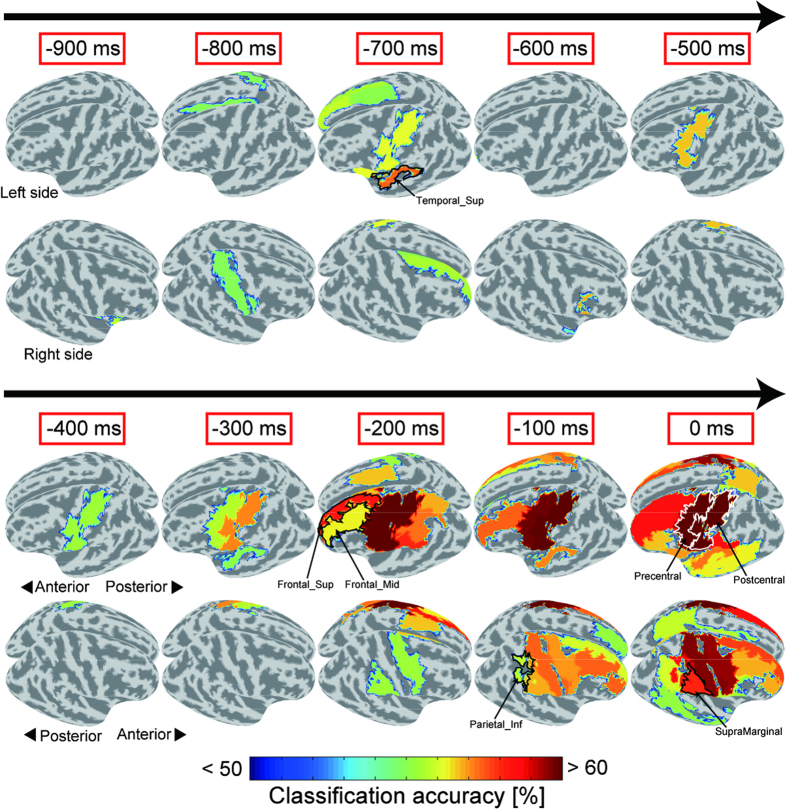
Figure 4. Classification accuracies in separate regions over entire cortical surface.
Averaged classification accuracies were calculated in 80 AAL map regions and overlaid on cortical surface from 900 to 0 ms before target onset in 100-ms steps. Regions were colored only when their classification accuracies were significantly above chance (n = 8, both two-tailed t-test p < 0.05 and group-level permutation test p < 1 × 10⁻⁴). Arrows denote flow of time during delay period. Upper panel in each time window shows upper-left side of cerebral hemispheres while lower panel shows upper-right side.

