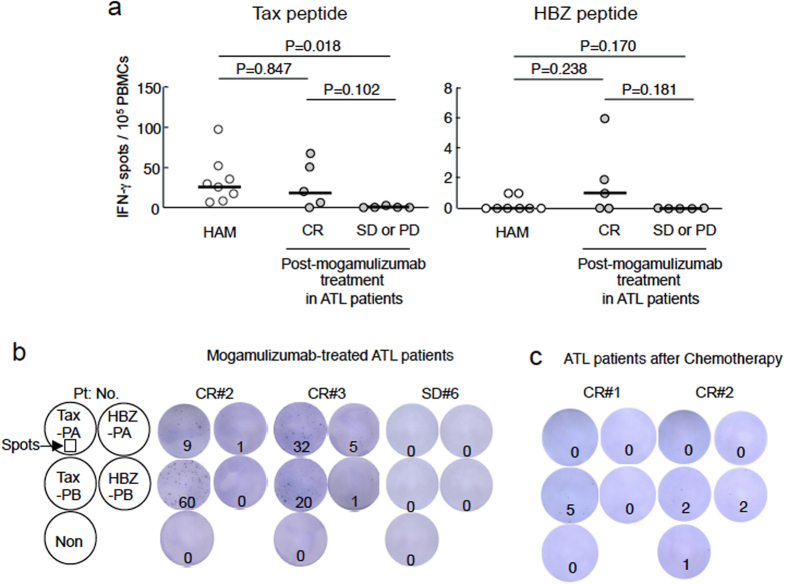
Figure 6. Enhanced T cell response to Tax and HBZ in mogamulizumab-treated ATL patients.
(a) IFN-γ production in T cells from HAM/TSP (n = 8) and mogamulizumab-treated ATL patients (n = 10, 5 in complete remission (CR) and 5 in stable disease (SD) or progressive disease (PD)) was measured after stimulation with Tax and HBZ pooled peptides. Data shown are the total number of spots obtained by stimulation with Tax-PA (Tax1–164) and -PB (Tax151–353), or HBZ-PA (HBZ1–104) and -PB (HBZ91–206). (b) Two ATL patients (CR2 and CR3) showed enhanced HTLV-1 specific T-cell responses to Tax and HBZ after mogamulizumab treatment. (c) T-cell responses to Tax and HBZ in two ATL patients who were in CR after chemotherapy. Median values are represented by horizontal bar.

