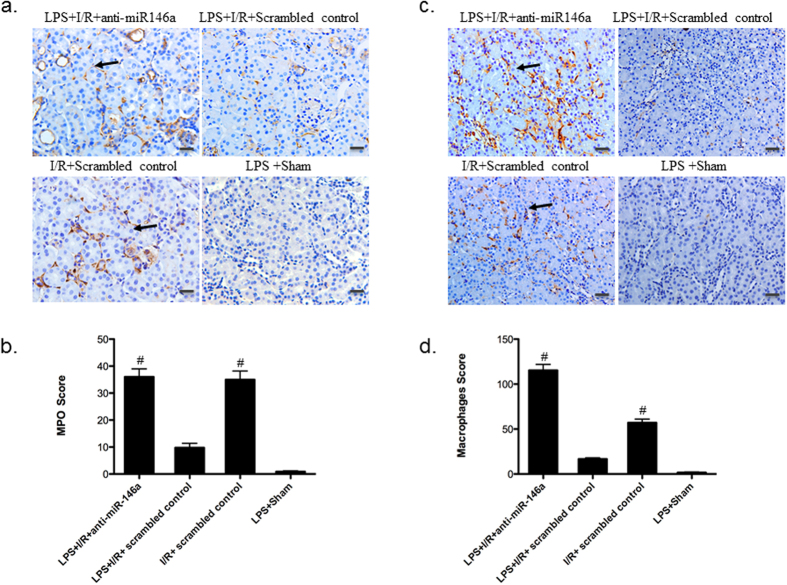
Figure 4. Inflammatory cell infiltration.
(a) Representative kidney sections immunostained for myeloperoxidase (MPO) to show polymorphonuclear (PMN) leukocyte infiltration (original magnification x200, Bar = 50 um, the black arrow indicates positive area). (b) PMN infiltration was scored in mouse kidney. (n = 6 mice per group, #P < 0.001, vs. LPS + I/R + Scrambled control). (c) Representative kidney sections immunostained for CD68 to show macrophage accumulation within the interstitium of the kidney (original magnification x200, Bar = 50 um). (d) Analysis of macrophage infiltration in mouse kidney. (n = 6 mice per group, #P < 0.001, vs. LPS + I/R + Scrambled control). All data were expressed as mean ± SEM.

