
Figure 3. Tissue distribution of TGF-β1 molecule in culter fish.
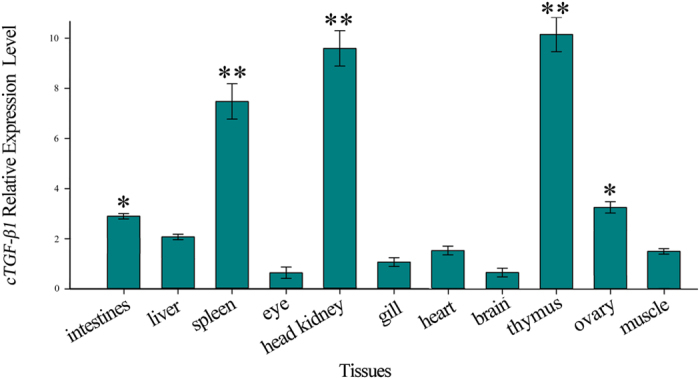
The results are represented as the mean ± SEM of 8 individual fish. The data were compared relative to β-actin (endogenous control) and were normalized to the expression in the gill.
Official websites use .gov
A
.gov website belongs to an official
government organization in the United States.
Secure .gov websites use HTTPS
A lock (
) or https:// means you've safely
connected to the .gov website. Share sensitive
information only on official, secure websites.
The results are represented as the mean ± SEM of 8 individual fish. The data were compared relative to β-actin (endogenous control) and were normalized to the expression in the gill.