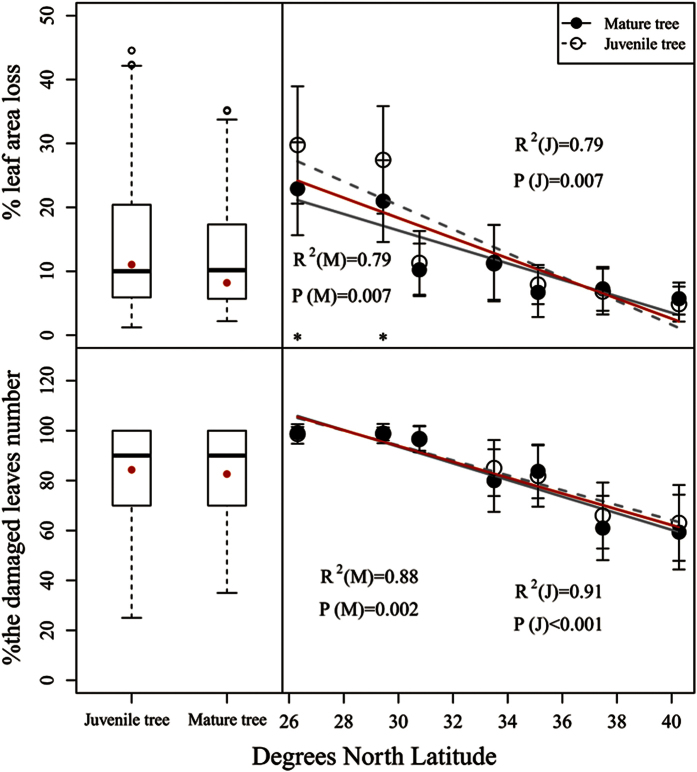
Figure 4. Herbivory (%, percentage of leaf area loss and percentage of damaged leaf number) (mean ± sd) across the latitudinal gradient.
40.27, Pinggu, Beijing; 37.48, Lincheng, Hebei; 35.06, Jiyuan, Henan; 33.50, Neixiang, Henan; 30.77, Zigui, Hubei; 29.45, Cili, Hunan; and 26.30, Chengbu, Hunan. The R2 coefficients and P values shown were obtained using simple linear regression models. Each point represents the mean at a certain latitudinal site (a total of 4 plots were established at each latitudinal site; three juvenile and three mature trees were chosen per plot for sampling purposes). Approximately 900 replicates (leaves) per site were used for the assessment of herbivory. Asterisks represent significant differences at P < 0.05 (*) based on a T-test.

