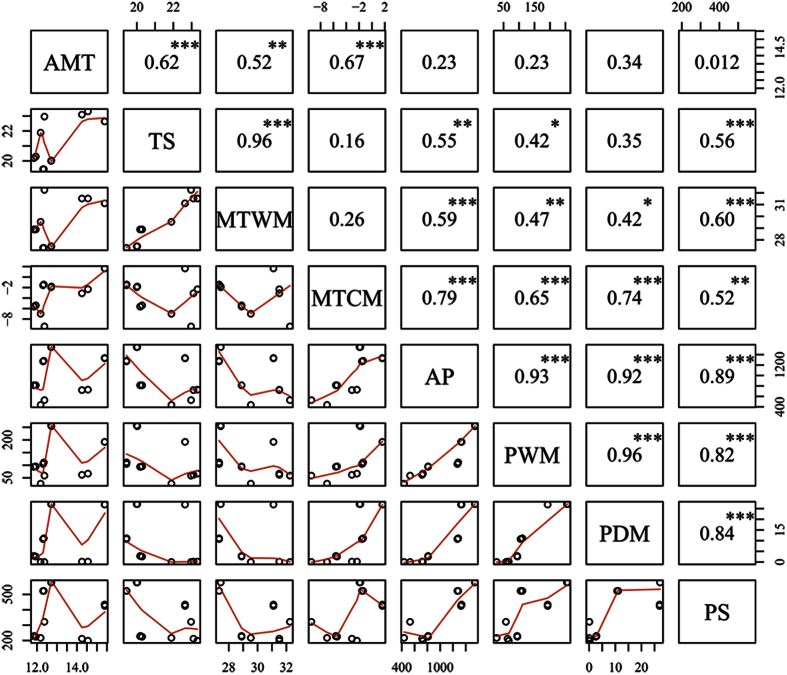
Figure 7. Correlation analysis among eight meteorological variables in 2014.
The variables are listed as follows: AMT (annual mean temperature, °C); TS (temperature seasonality, expressed as the standard deviation of temperature among months * 100); MTWM (maximum temperature of the warmest month, °C); MTCM (minimum temperature of the coldest month, °C); AP (annual precipitation, mm); PWM (precipitation of the wettest month, mm); PDM (precipitation of the driest month, mm); and PS (precipitation seasonality, expressed as the coefficient of the variation in precipitation across months). Only significant effects are shown: *P < 0.05; **P < 0.01; ***P < 0.001.

