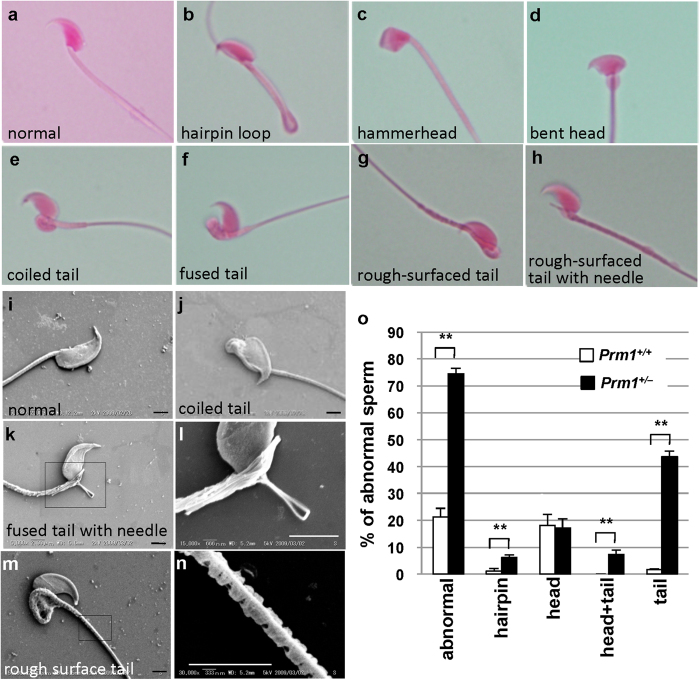
Figure 4. Sperm morphology, as indicated by eosin staining and scanning electron microscopy.
(a–h) Eosin staining. (i–n) SEM. l, higher magnification of (k). (n), Higher magnification of (m,o), frequencies of abnormal spermatozoa. Scale bar: 2 μm. Statistical analyses were performed using unpaired Student’s t-tests (*P < 0.05, **P < 0.01).

