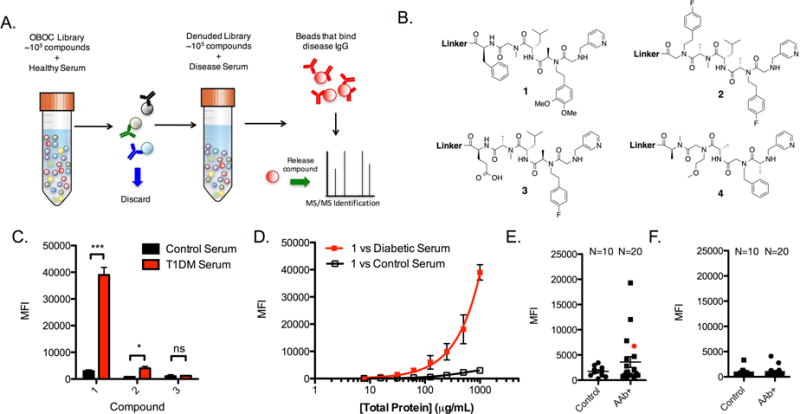
Figure 1. Compounds 1 and 2 are epitope surrogates for diabetes-related antibodies.

A) Illustration of the general comparative screening procedure. A OBOC library is mixed with healthy serum and beads that bind high levels of antibody are removed with an appropriately tagged secondary antibody. The remaining library is incubated with disease serum and beads that bind significant antibody are isolated. The compound is released from the bead and identified by tandem mass spectrometry. See also Figure S1. B) Chemical structures of compounds used throughout this study. See also Figure S2. C) Binding experiment using the liquid array platform wherein compounds 1–3 are immobilized onto the 10 μm TentaGel bead liquid array. The beads were mixed with diluted serum and fluorescent secondary antibody and binding of serum IgG antibodies was measured as the mean fluorescence intensity (MFI) of the beads using a flow cytometer. D) Binding isotherm generated for 1 using serially diluted concentrations of diabetic or healthy control serum and read using the cytometry assay. E) Analysis of 10 control serum samples and 20 AAb+ serum samples for binding to compound 1 using the cytometry binding assay. Serum was collected from 10 of the diabetes patients who were positive for classic T1D antibodies, but had not yet experienced hyperglycemia at the time of blood collection. F) Antibody binding to control compound 3 using 10 control serum samples and 20 AAb+ serum samples using the cytometry assay. Conditions for binding experiments: 500 μg mL−1 diluted serum in binding buffer for 1.5 h at room temperature. Binding experiment data reported in bar and line graphs represent the mean fluorescence intensity ± s.d. from three experiments. Statistical significance was determined using an unpaired t-test: *P < 0.05; ***P < 0.001; ns = not significant. Each dot plot data point is the average of two independent measurements for each serum sample tested.
