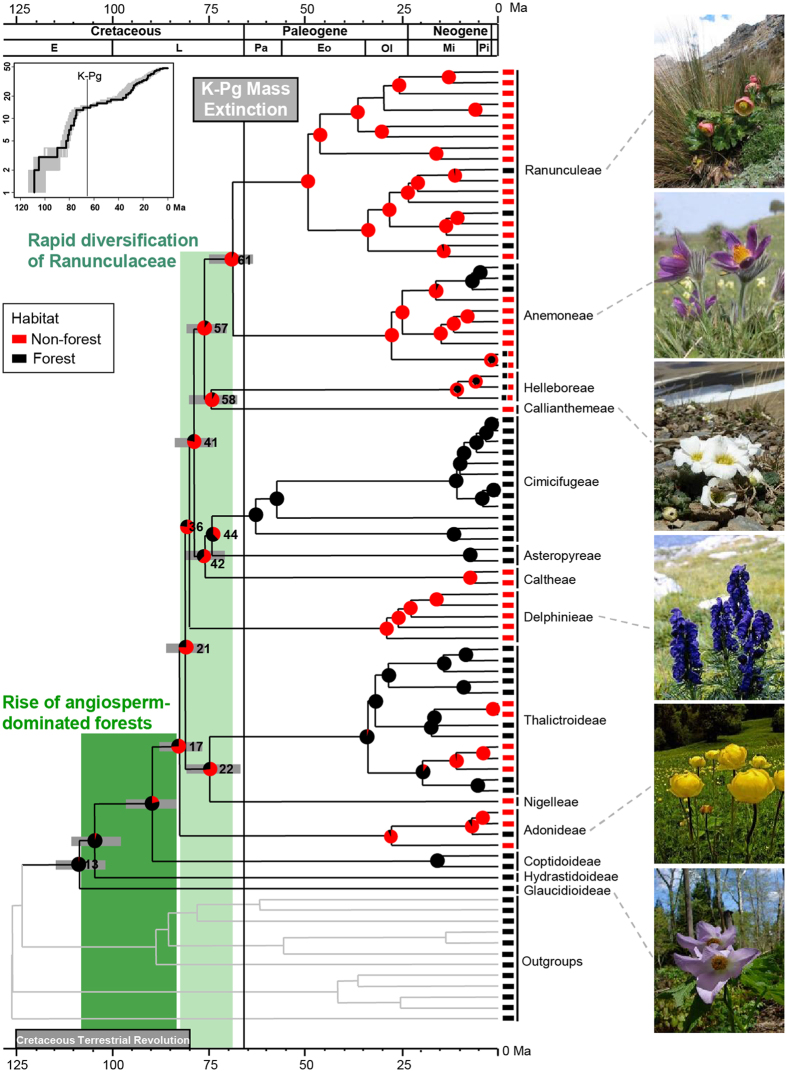
Figure 1. Phylogenetic chronogram and ancestral habitat reconstruction of extant Ranunculaceae.
The timetree was generated by using all calibration points (analysis 1). Gray bars represent 95% highest posterior density of node age at subfamilial and tribal levels. Node numbers refer to Supplementary Fig. 2. Color-coded pie diagrams represent the probabilities of different states at each node under Bayesian inference. Our results indicate that the rapid diversification of Ranunculaceae (laurel-green shade) occurred after or at the end of the rise of angiosperm-dominated forests (green shade20). A standard LTT plot for the 108.79 Ma history of Ranunculaceae is present in the upper left, exhibiting a three-phase scenario in lineage accumulation before 48 Ma. Photographs by S.X.Y.

