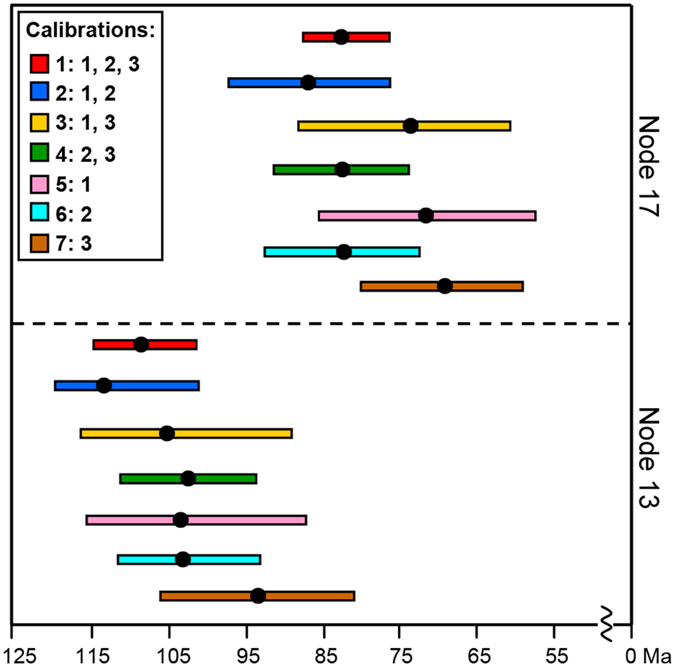
Figure 2. Summary of the crown age of Ranunculaceae (node 13) and the age of habitat shifts (node 17) under seven analytical scenarios.

Dark dots represent mean ages. Horizontal bars represent 95% highest posterior density.

Dark dots represent mean ages. Horizontal bars represent 95% highest posterior density.