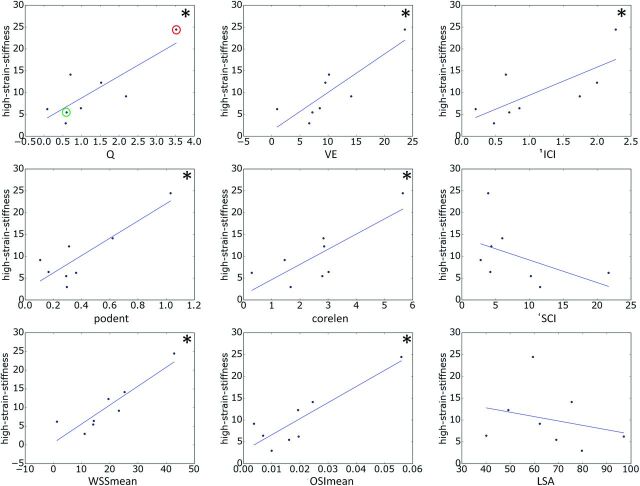
Fig 3.
Relationships between hemodynamic variables and wall stiffness at high stress. Each correlation that reached statistical significance (95% confidence) is marked with an asterisk. In the top-left panel, aneurysms CA26 and CA15, exemplified in Figs 4 and 5, are marked with green and red circles, respectively. Corelen indicates vortex core-line length; ICI, inflow concentration index; LSA, area under low wall shear stress relative to the parent vasculature; OSImean, mean oscillatory shear index; podent, POD entropy; Q, aneurysm inflow rate; SCI, shear concentration index; VE, aneurysm mean velocity; WSSmean, mean wall shear stress.

