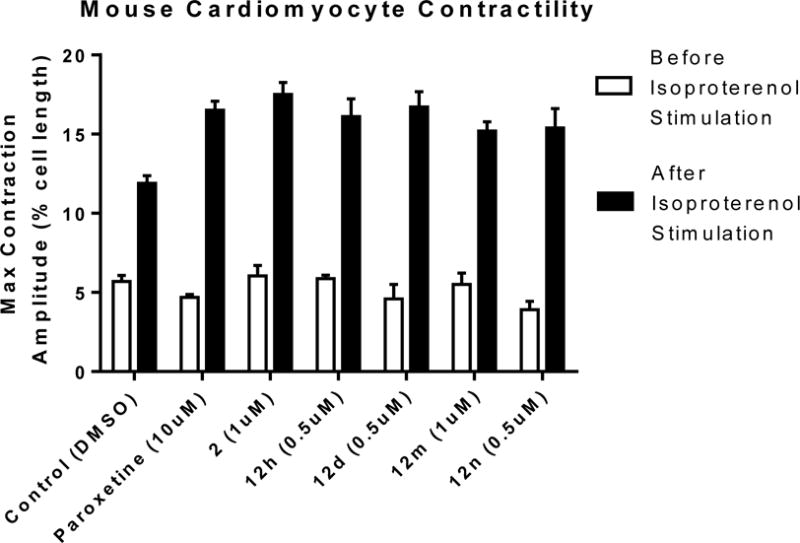
Figure 9.

Maximum contraction amplitudes of the known GRK2 inhibitor paroxetine, the lead 2, 12h, 12d,12m, and 12n before and after isoproterenol stimulation. Doses shown are the minimum inhibitory concentrations that exhibit a p-value <0.05 versus Control. Values represent the mean ± SEM for 8–10 cardiomyocytes.
