Figure 1.
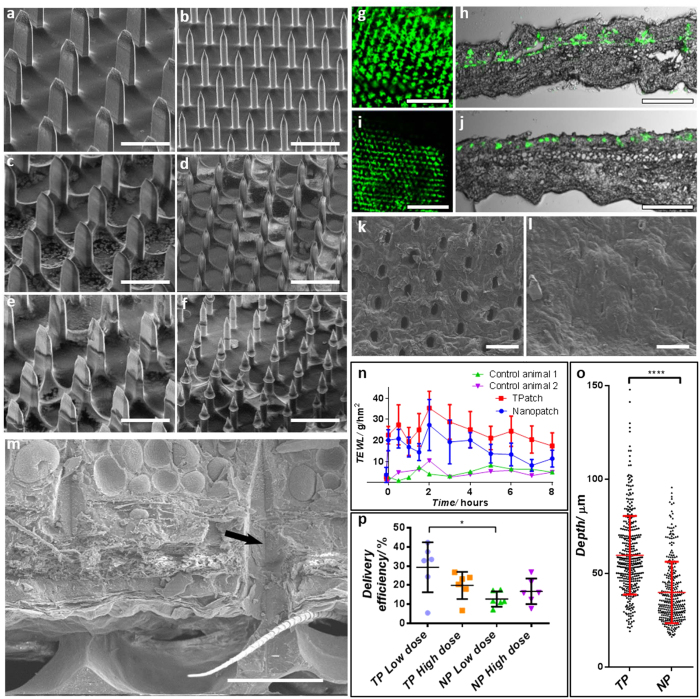
Uncoated, coated and post-application SEM images of TPs (a,c,e respectively) and NPs (b,d,f respectively); delivered fluorescent dye in skin, viewed form above and in transverse section for TPs (g,h respectively) and NPs (i,j respectively); top-down CryoSEM view of skin surface puncture during TP in-situ placement (k) and immediately following application showing closed sin perforations (l); (m) shows in-situ CryoSEM image of skin impressions from TPs, with an arrow indicating lines of the cutting/puncturing surface; a comparison of skin surface healing following TP and NP application is shown by TEWL changes over time (n); (o) shows that the TP reaches a significantly deeper location of antigen delivery in the skin, derived from fluorescent section measurement (***p < 0.001); delivered dose of vaccine is compared between high (50 ng) and low (5 ng) dose on the TP and NP, applied to skin in p (*p < 0.05). Statistics show mean ± standard deviation, significance is by one-way ANOVA. Bars a–f, k, l = 100 μm, g, j = 200 μm, h, j = 500 μm, m = 50 μm.

