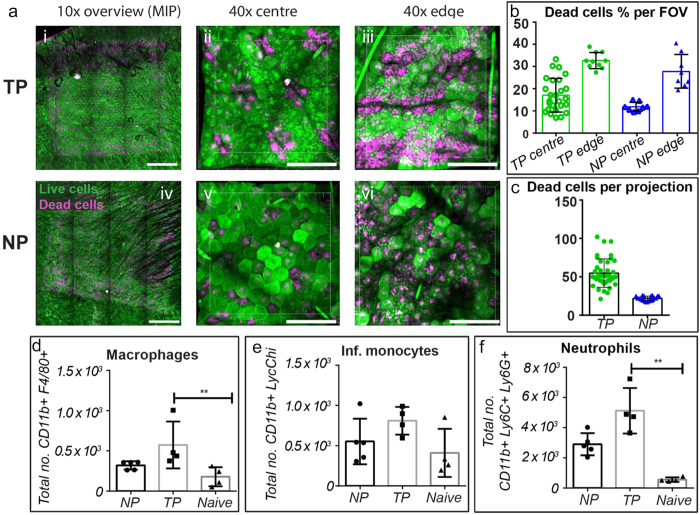
Figure 2.
(a)–skin stained to show live (green) and dead (magenta) cells following TP and NP applications, at low magnifications and high magnifications of the center of the patches and at the edge; quantified levels of live/dead cells following TP and NP applications (b,c). (d–f) show changes in macrophage, infiltrating monocytes and neutrophils in skin following patch applications (**p < 0.01 using one-way ANOVA).

