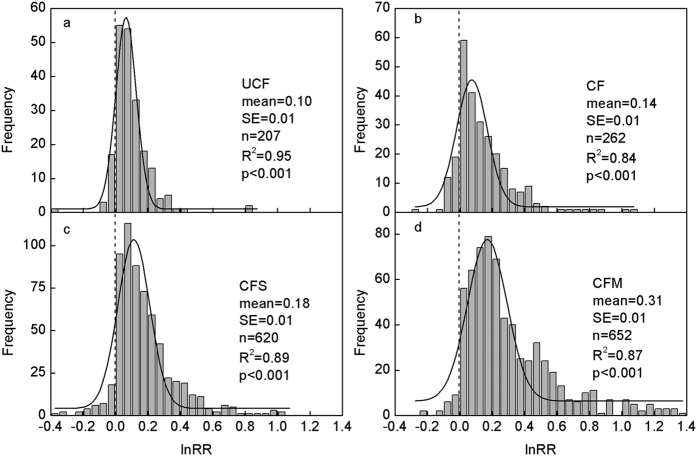
Figure 1. Frequency distributions of response ratios (lnRRs) for SOC under four treatments.
UCF, CF, CFS and CFM represent the unbalanced application of chemical fertilizers, balanced application of chemical fertilizers, straw return and application of chemical fertilizers, and application of manure and chemical fertilizers. The solid curve is a Gaussian distribution fitted to frequency data. The vertical dashed line is at lnRR = 0.

