
Figure 7. Percentages of treatments producing C sinks and C sources among the total treatments in different C input groups.
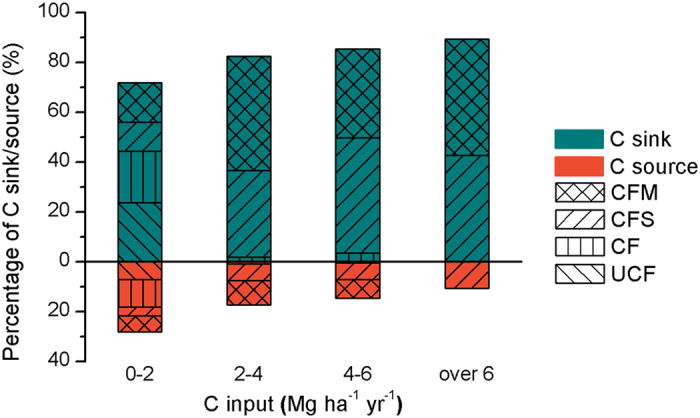
When the difference between SOC in the final year and SOC in the initial year is bigger than 0, the soil is a C sink, and the opposite is a C source.