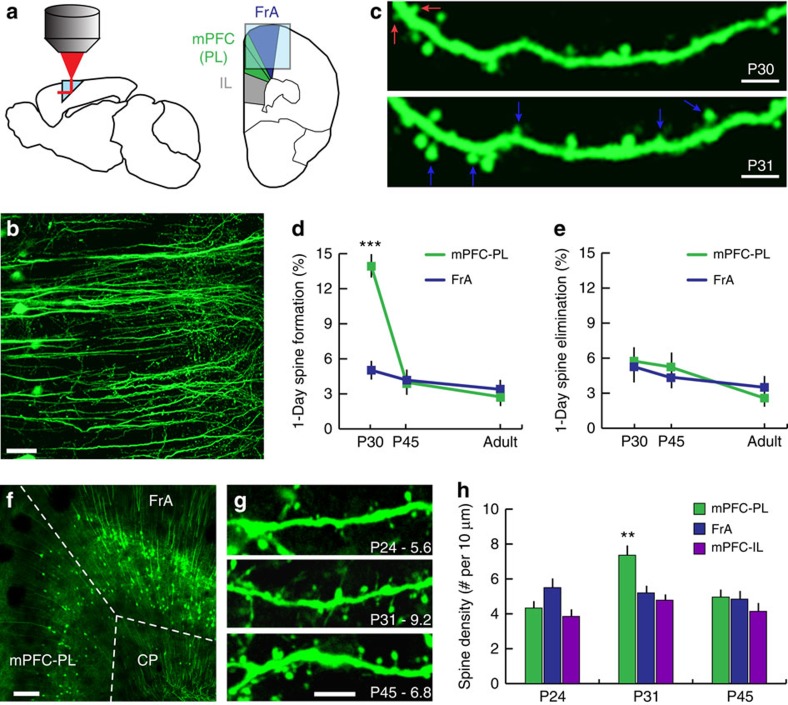
Figure 1. Imaging spine remodelling in mPFC.
(a) Schematic for in vivo spine imaging in mPFC and FrA through a prism. The majority of analysed mPFC neurons reside in PL, although some may reside in the cingulate area of mPFC, dorsal to PL. IL neurons were excluded because they lie ventral to the prism. (b) YFP-expressing PL pyramidal neurons in Thy1/YFP-H line transgenic mice. (c) Spine remodelling was quantified in repeated images acquired at 1-day intervals. Eliminated spines (red arrow) were present at P30 but not P31. Formed spines (blue arrows) were present at P31 but not P30. (d) There were significant main effects of age (F(2,23)=87.3, P<0.0001) and cortical region (F(1,23)=41.4, P<0.0001) on spine formation (age X region interaction: F(2,23)=58.7, P<0.0001). Specifically, 1-day spine formation rates were selectively increased at P30 in mPFC compared with FrA (P<0.001, post hoc linear contrast). There were no significant regional differences at P45 or P90. (e) There was a significant main effect of age (F(2,23)=7.72, P=0.003) on spine elimination, but not of cortical region (F(1,23)=0.01, P=0.937). (f,g) Confocal images of YFP-expressing pyramidal cells in fixed tissue samples obtained at P24, P31 and P45. High-magnification images in g are from typical dendritic segments in PL (# spines/10 μm indicated at lower right). CP, Caudate/Putamen. (h) Quantification of developmental changes in spine density in PL, FrA and IL at P24, P31 and P45 (N=4–5 mice/age). There were significant main effects of region (F(2,31)=7.34, P=0.002) and age (F(2,31)=8.16, P=0.001), and an age X region interaction (F(4,31)=4.4, P=0.006), driven by an increase in spine density in PL at P31 relative to P24 (P=0.004) and P45 (P=0.007). Scale bars, 50 μm (b), 5 μm (c and g) and 150 μm (f). Error bars=s.e.m.; ***P<0.001; **P<0.01 for contrasts of P31 versus P24 and P45.

