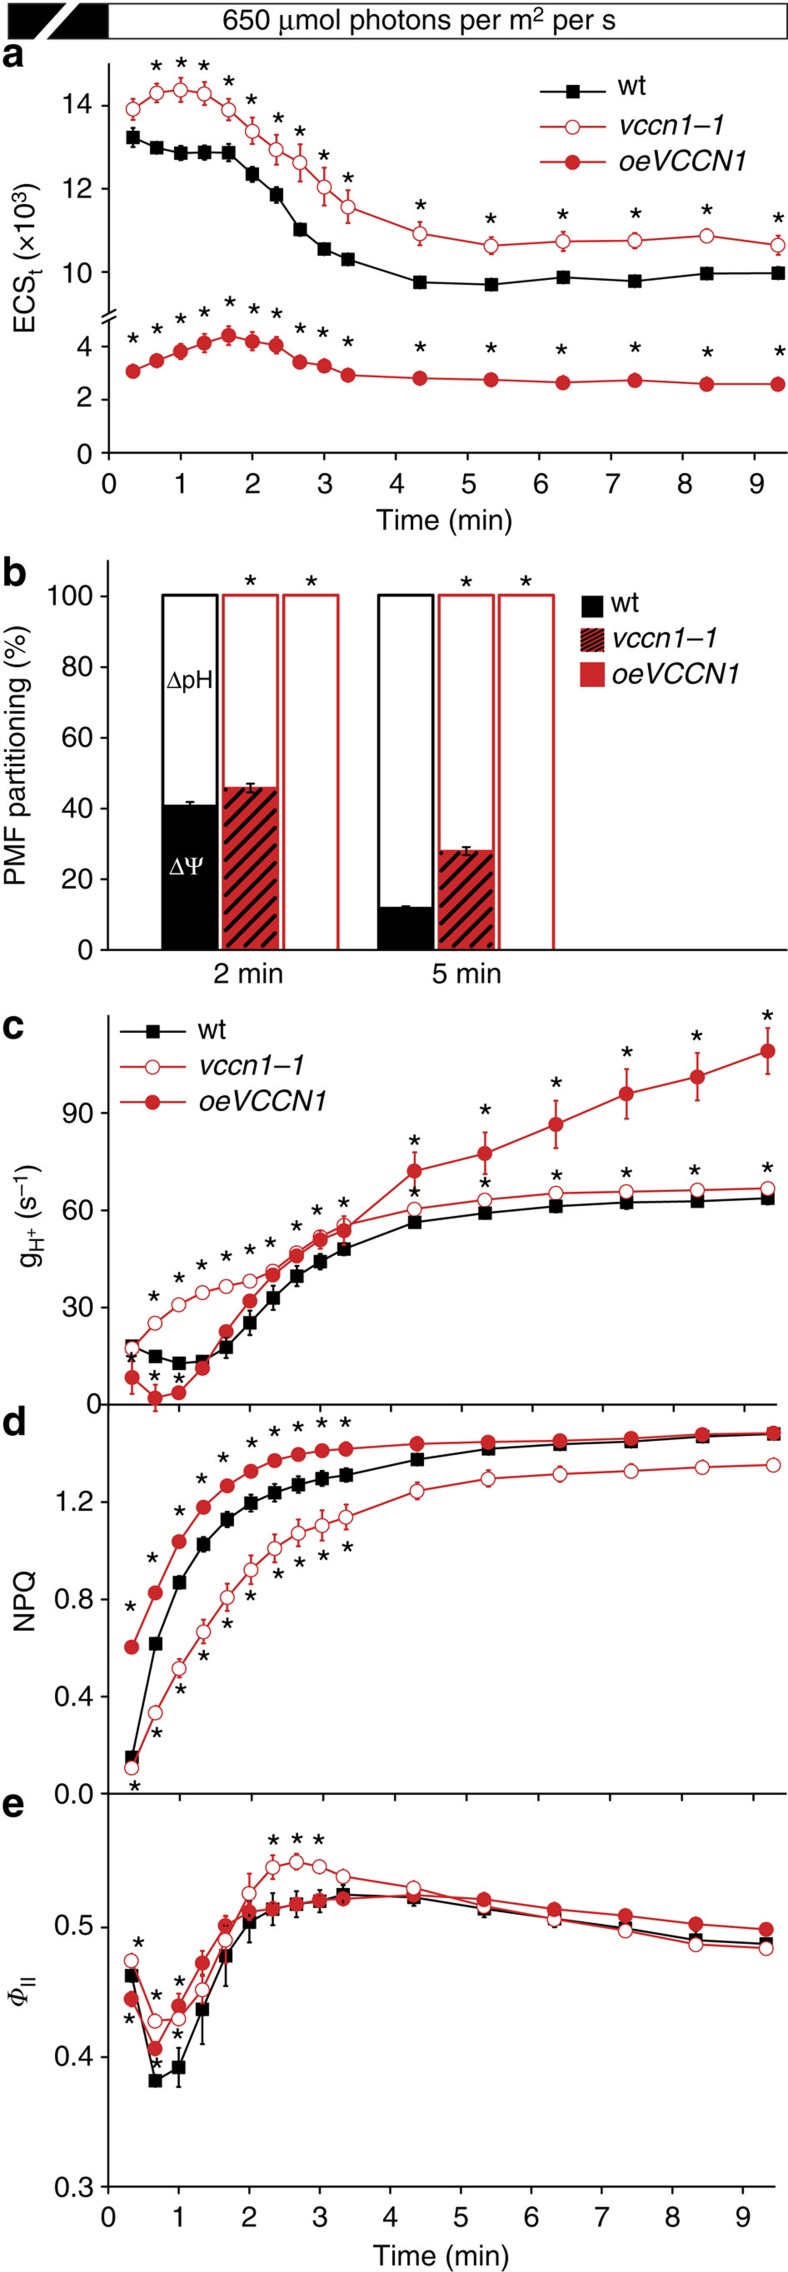
Figure 3. Kinetics of proton motive force and photosynthetic acclimation on transition from dark to light.
(a) Kinetics of ECSt (total electrochromic shift, a measure of total proton motive force size, PMF) in wild-type plants (wt), vccn1-1 knockout mutant and mutant overexpressing AtVCCN1 (oeVCCN1) were recorded at 650 μmol photons per m2 per s after 30 min dark adaptation. (b) Fraction of PMF contributed by transmembrane electric-potential gradient (ΔΨ) and H+ concentration gradient (ΔpH) at two time points in the light. (c) H+ conductivity through ATP synthase (gH+) was determined from ECS decay kinetics. (d) Kinetics for induction of non-photochemical quenching (NPQ) as a measure of photoprotective mechanisms were recorded during 10 min of illumination at 650 μmol photons per m2 per s. (e) Photosystem II quantum yield (ΦII) as a measure of linear electron transport was calculated from the same experiment as NPQ. Data are the means ±s.e.m. (n=5). Where not visible, error bars are smaller than the symbols. Asterisks denote a statistically significant difference between wt and mutants (Student's t-test, P<0.05).

