
Fig. 2.
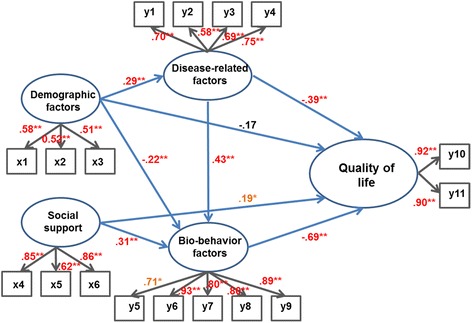
Path diagram for the hypothetical model. * P < 0.05; ** P < 0.01. x1 = Age; x2 = Education level; x3 = Economic status; x4 = Family support; x5 = Friend support; x6 = Special support; y1 = Dilatation of sinus of Valsalva; y2 = Fibrillin-1 mutation; y3 = Family history of Marfan syndrome; y4 = Frequency of operations on the cardiovascular system; y5 = Anxiety; y6 = Depression; y7 = Fatigue; y8 = Pain; y9 = Body image; y10 = Physical component score; y11 = Mental component score