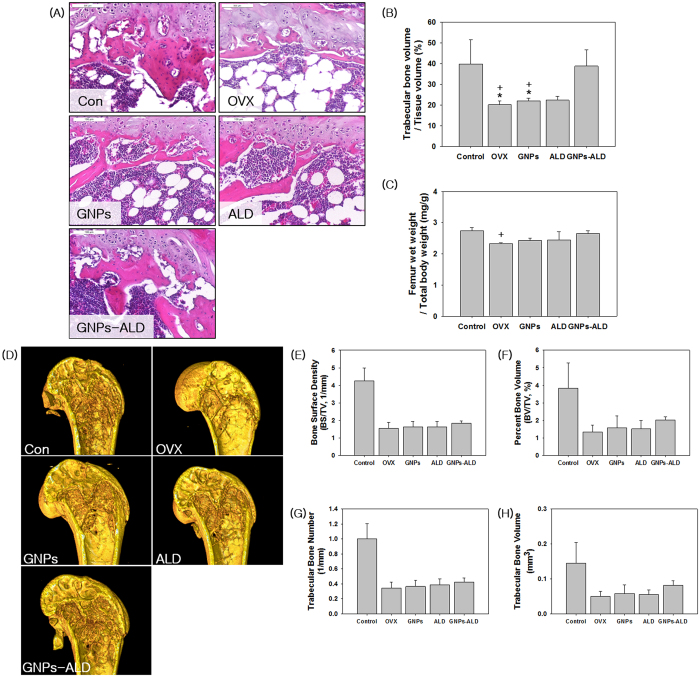
Figure 5. Histological, relative femur wet weight and μ-CT analysis from Control, OVX, GNPs, ALD and GNPs-ALD groups.
Sections of trabecular bone in the metaphyseal region of the distal femur were stained using Hematoxylin & Eosin and observed by using a microscope (x100) (A). Trabecular dimensions and continuity are greater in Con and GNPs-ALD groups than the other groups. Relative trabecular bone volume showed OVX, GNP, ALD groups had lower trabecular bone volume than Con and GNPs-ALD groups (B). Averages of bilateral femur wet weight (mg) per total body weight (g) were calculated (C). Relative femur weights of GNPs-ALD group were higher than other groups in the ovariectomized groups (except Con group). Results are mean ± SD of triplicate experiments: +p < 0.05, significant difference as compared with control group and *p < 0.05, significant difference as compared with GNPs-ALD group. Scale bars are 100 μm. Reconstruction images of femur (D) and average value of bone surface density (1/mm, E), percent bone volume (%, F), trabecular bone number (G) and trabecular bone volume (H) by μ-CT. These were evaluated after producing the femur images as 2240 × 2240 pixel, 5.33 μm resolution and 4 frame averaging.

