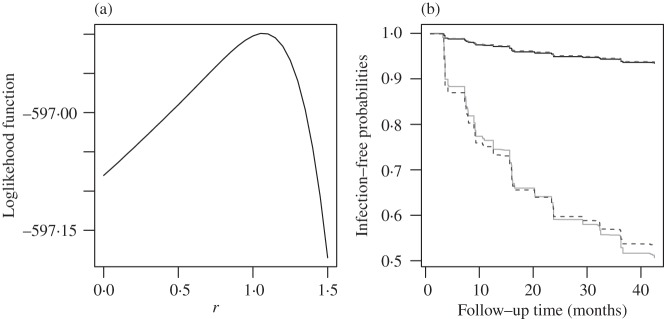
Fig. 2.
Analysis of the Bangkok Metropolitan Administration HIV-1 study: (a) the loglikelihood
at the nonparametric maximum likelihood estimates plotted as a function of
 in the logarithmic transformations; (b) estimation of
infection-free probabilities, where the upper lines correspond to a low-risk subject
under the proportional hazards (solid) and proportional odds (dashed) models, and the
lower lines correspond to a high-risk subject under the proportional hazards (solid) and
proportional odds (dashed) models.

