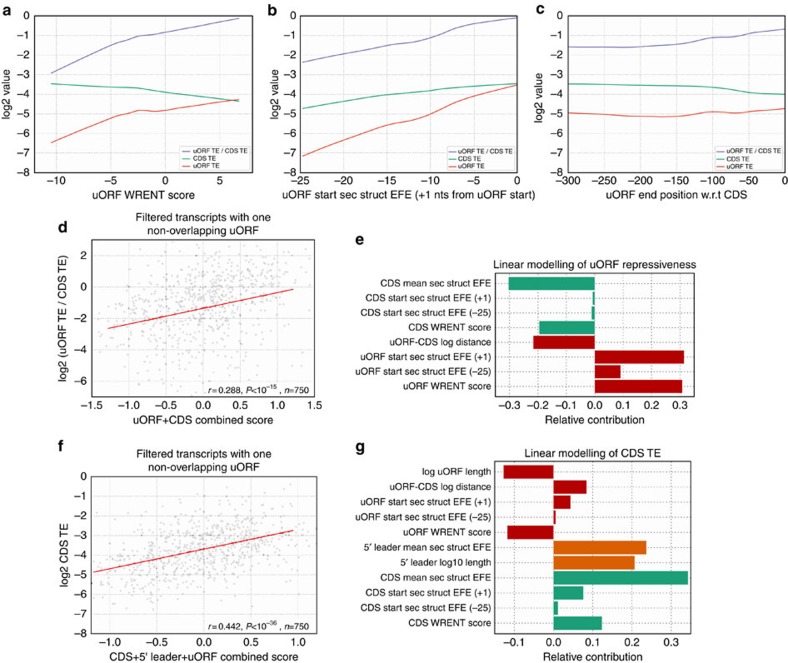
Figure 3. Modelling of uORF repressiveness and CDS TE with various transcript sequence features.
(a–c) Relationship between (a) uORF initiation context sequence, (b) secondary structure and c. uORF-end position w.r.t. (with respect to) CDS against uORF TE (red), CDS TE (green) and uORF TE / CDS TE (blue). uORF repressiveness (estimated from uORF TE / CDS TE) increases with more favourable initiation context sequence (a), decreased secondary structure around uORF initiation sites (b) and reduced uORF-CDS distance (c). All lines are LOWESS fits representing statistically significant rank and linear correlations (P<0.05; details in Supplementary Fig. 6) except for uORF TE against uORF-end position w.r.t. CDS (c). (d,e) Linear modelling of uORF/CDS TE with uORF and CDS sequence features, for transcripts with one non-overlapping uORF. Scatter plot of uORF TE / CDS TE against a combined score that integrates uORF and CDS sequence features; red line indicates the ridge regression linear fit (d); relative contributions of individual sequence features to the combined score are depicted in e. (f,g) Linear modelling of CDS TE with uORF, 5′ leader and CDS sequence features, for transcripts with one non-overlapping uORF. Scatter plot of CDS TE is against a combined score that integrates various sequence features; red line indicates the ridge regression linear fit (f); relative contributions of individual sequence features to each score are depicted in g.

