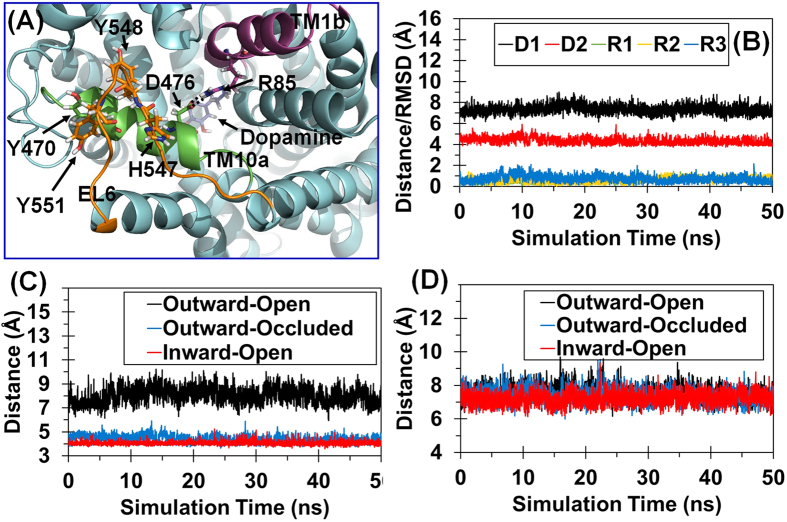
Figure 2. MD-simulated WT hDAT structures in the three typical conformational states.
(A) Structural model of WT hDAT in the outward-occluded state. hDAT is in cyan cartoon style. TM1b (the second part of transmembrane helix 1), TM10a, and EL6 are in purple, green, and orange, respectively. Dopamine and key residues are showed in stick-ball style. Hydrogen bonds between D476 and R85 are indicated in dashed lines. (B) Tracked distances and positional RMSD values for WT hDAT. D1 indicates the tracked internuclear distance between the Cα atoms of Y470 and Y548. D2 refers to the tracked internuclear distance between Cγ atom of D476 and the Cζ atom of R85. The tracked changes of the RMSD for the Cα atoms of Y470, R85, and D476 are indicated by R1, R2, and R3, respectively. (C) Tracked internuclear distance between the Cγ atom of D476 and the Cζ atom of R85 in three typical conformational states of WT hDAT. (D) Tracked internuclear distance between the Cα atoms of Y470 and Y548 in three typical conformational states of WT hDAT.

