Fig. 2.

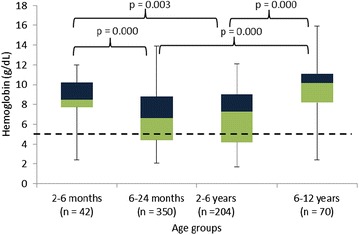
Box plot showing the distribution of haemoglobin (Hb) values for the different age groups. The dotted line represents the boundary of severe anaemia (Hb value <5 g/dL)

Box plot showing the distribution of haemoglobin (Hb) values for the different age groups. The dotted line represents the boundary of severe anaemia (Hb value <5 g/dL)