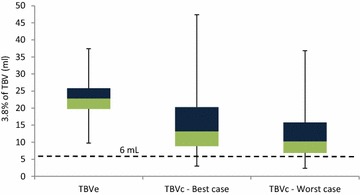
Fig. 3.

Box plot distribution of the actual volume (in mL) that represents the 3.8 % of total blood volume used as safety guideline for children aged 6–24 months (n = 350). Distributions are shown for the estimated and functional total blood volume (TBVe and TBVf), best and worst case scenario. The dotted line shows the intended blood volume to be drawn as part of a diagnostic study. Below the dotted line are the children for whom the 3.8 % safety guideline would have been violated
