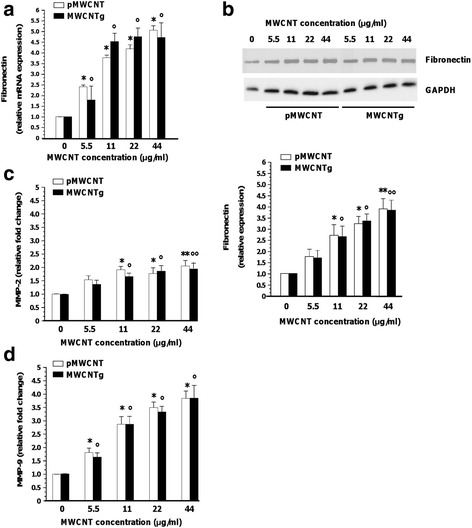
Fig. 3.

Relative expression of fibronectin (a-b) and metalloproteinases activity (c-d) in BEAS-2B cells exposed to MWCNT. Cells were incubated for 96 h in either the absence (0 μg/ml, control) or presence of pMWCNT or MWCNTg at the concentration of 5.5, 11, 22 and 44 μg/ml. a Relative expression of fibronectin mRNA checked by qRT-PCR. Results were expressed in units of relative mRNA expression compared to control cells (n = 3; white bar = pMWCNT; black bar = MWCNTg). Versus control *p < 0.0001; Versus control °p < 0.0001. b Relative expression of fibronectin protein checked by WB. Results were expressed in units of relative protein expression compared to control cells (white bar = pMWCNT; black bar = MWCNTg). Each figure is representative of three experiments giving similar results. Versus control *p < 0.05, **p < 0.0001; Versus control °p < 0.05, °°p < 0.0001. c-d Metalloproteinases activity checked by zymography. Results were expressed as relative fold change compared to control cells (white bar = pMWCNT; black bar = MWCNTg) (n = 3). c Versus control *p < 0.001, **p < 0.0001; Versus control °p < 0.001, °°p < 0.0001. d Versus control *p < 0.0001; Versus control °p < 0.0001
